

Question: ( a ) Q 1 2 . The graphs in the figure on the right show the displacement caused by a wave moving along a
a
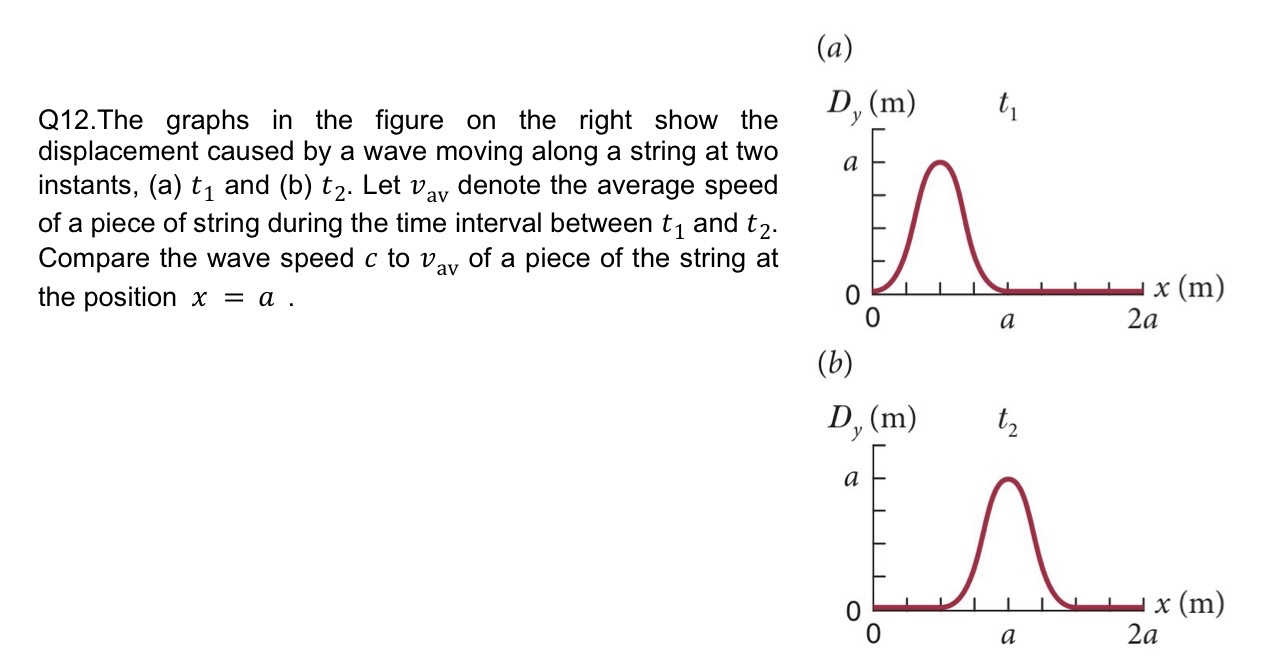
QThe graphs in the figure on the right show the displacement caused by a wave moving along a string at two instants, a and b Let denote the average speed of a piece of string during the time interval between and Compare the wave speed to of a piece of the string at the position
b
Step by Step Solution
There are 3 Steps involved in it
1 Expert Approved Answer
Step: 1 Unlock

Question Has Been Solved by an Expert!
Get step-by-step solutions from verified subject matter experts
Step: 2 Unlock
Step: 3 Unlock