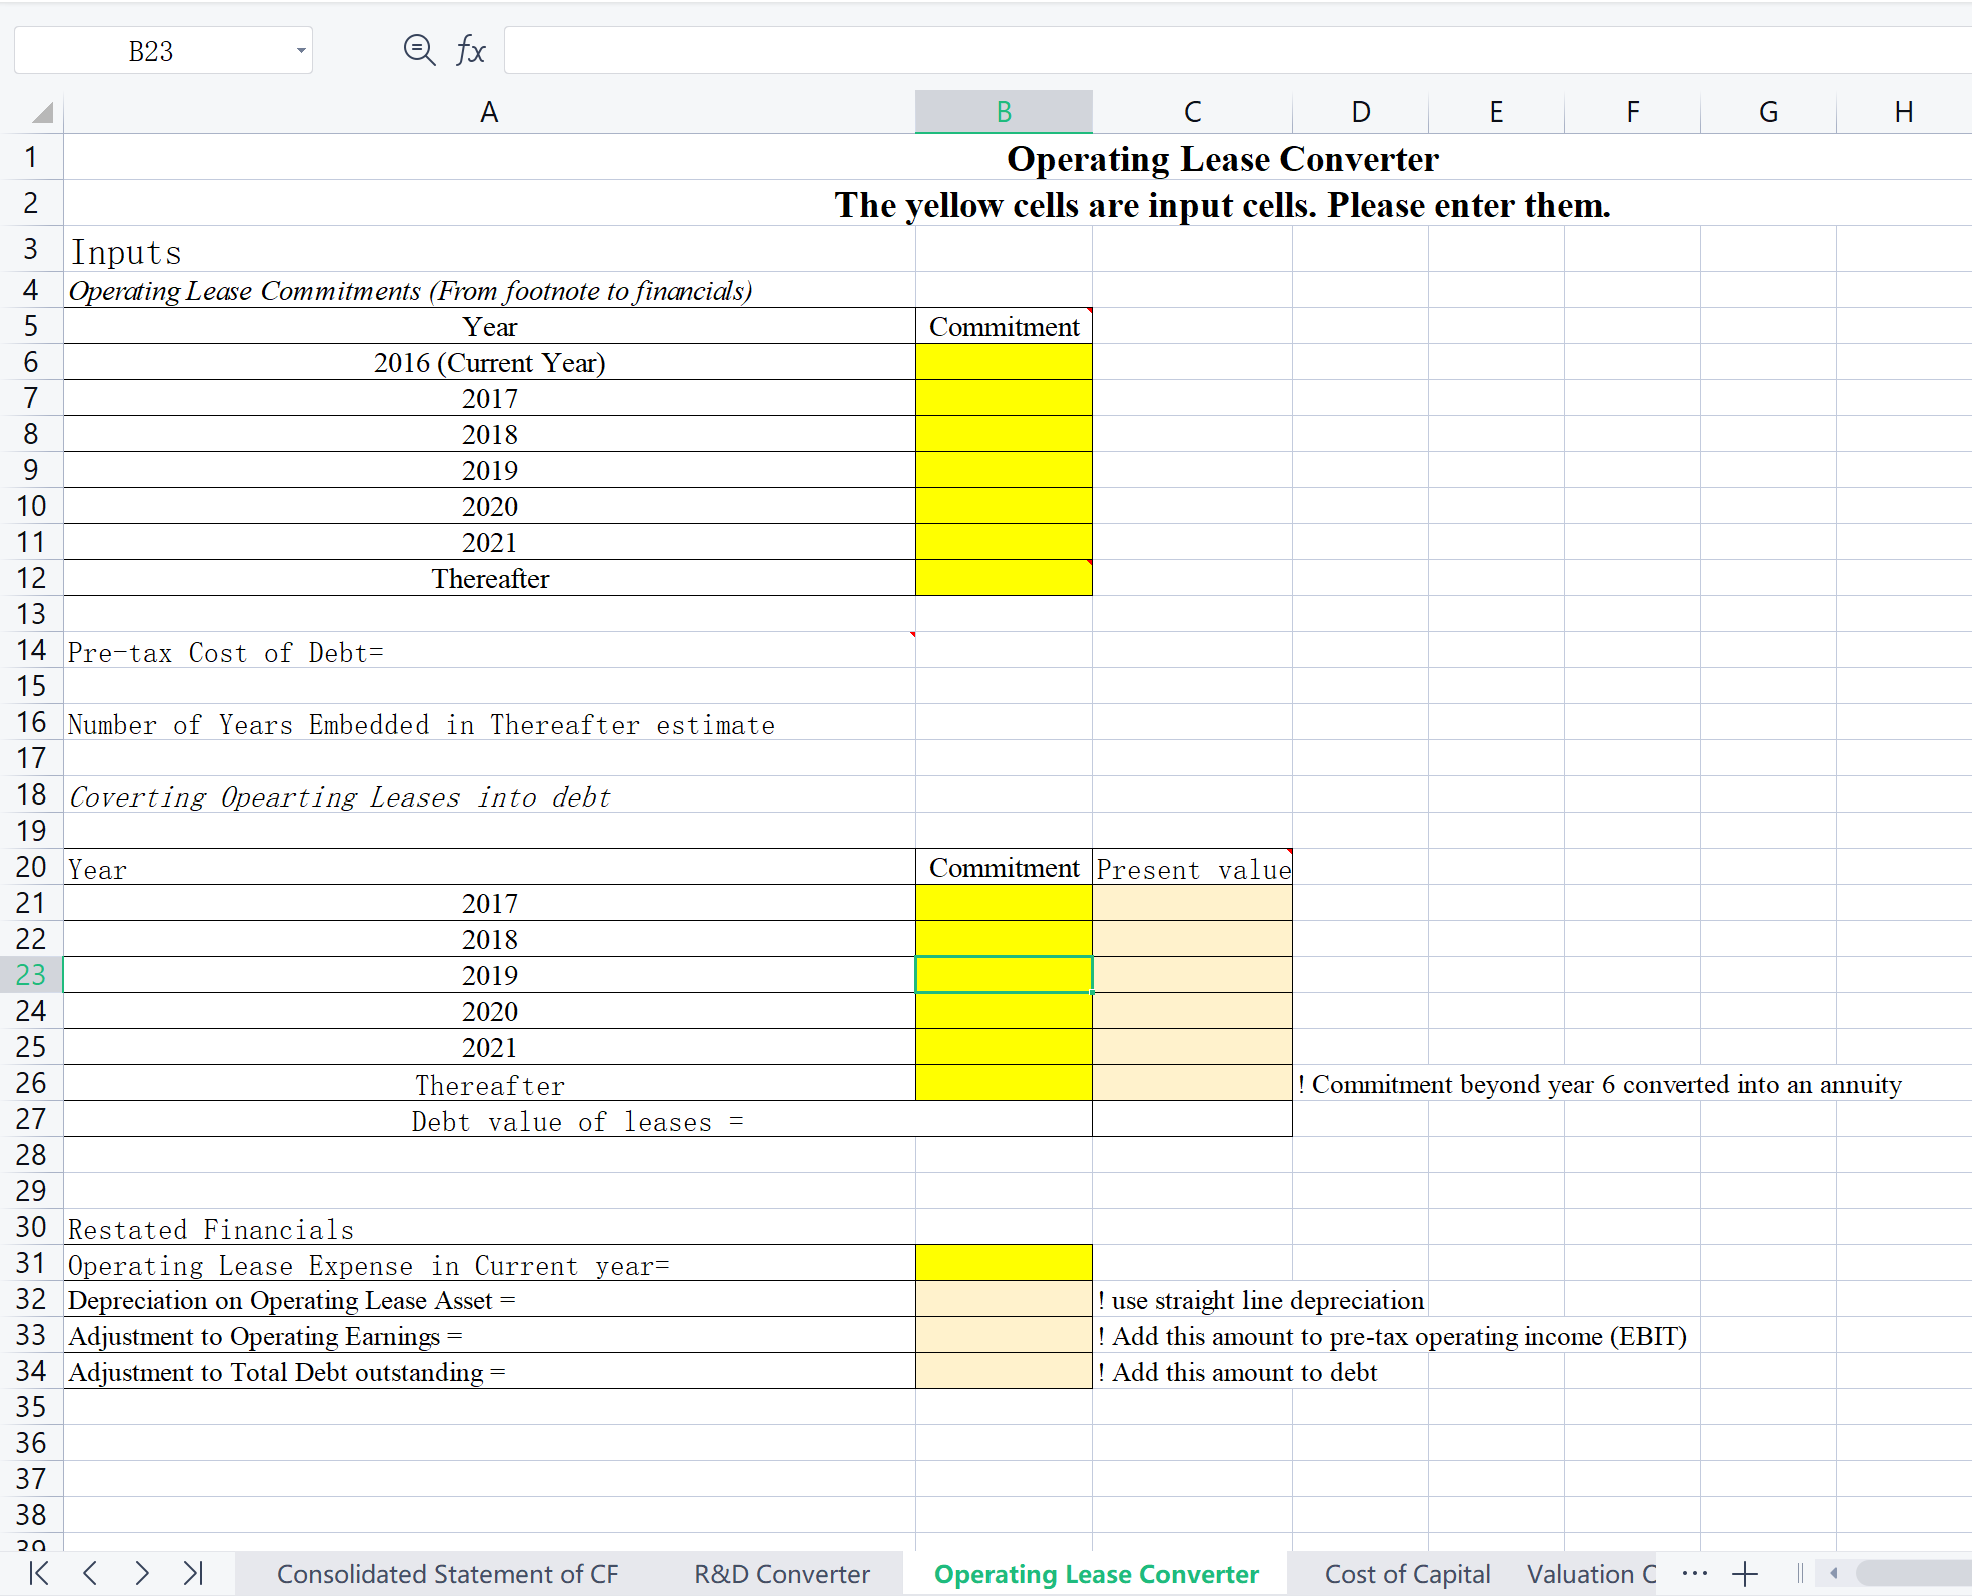
Question: A QOONOWW-bUJNI N _ _ _ _ _ _ _ _ _ _ )Olm)ld)')')t)')))o) [J _ N N [J UJ N 4:. 25_ 251 27_
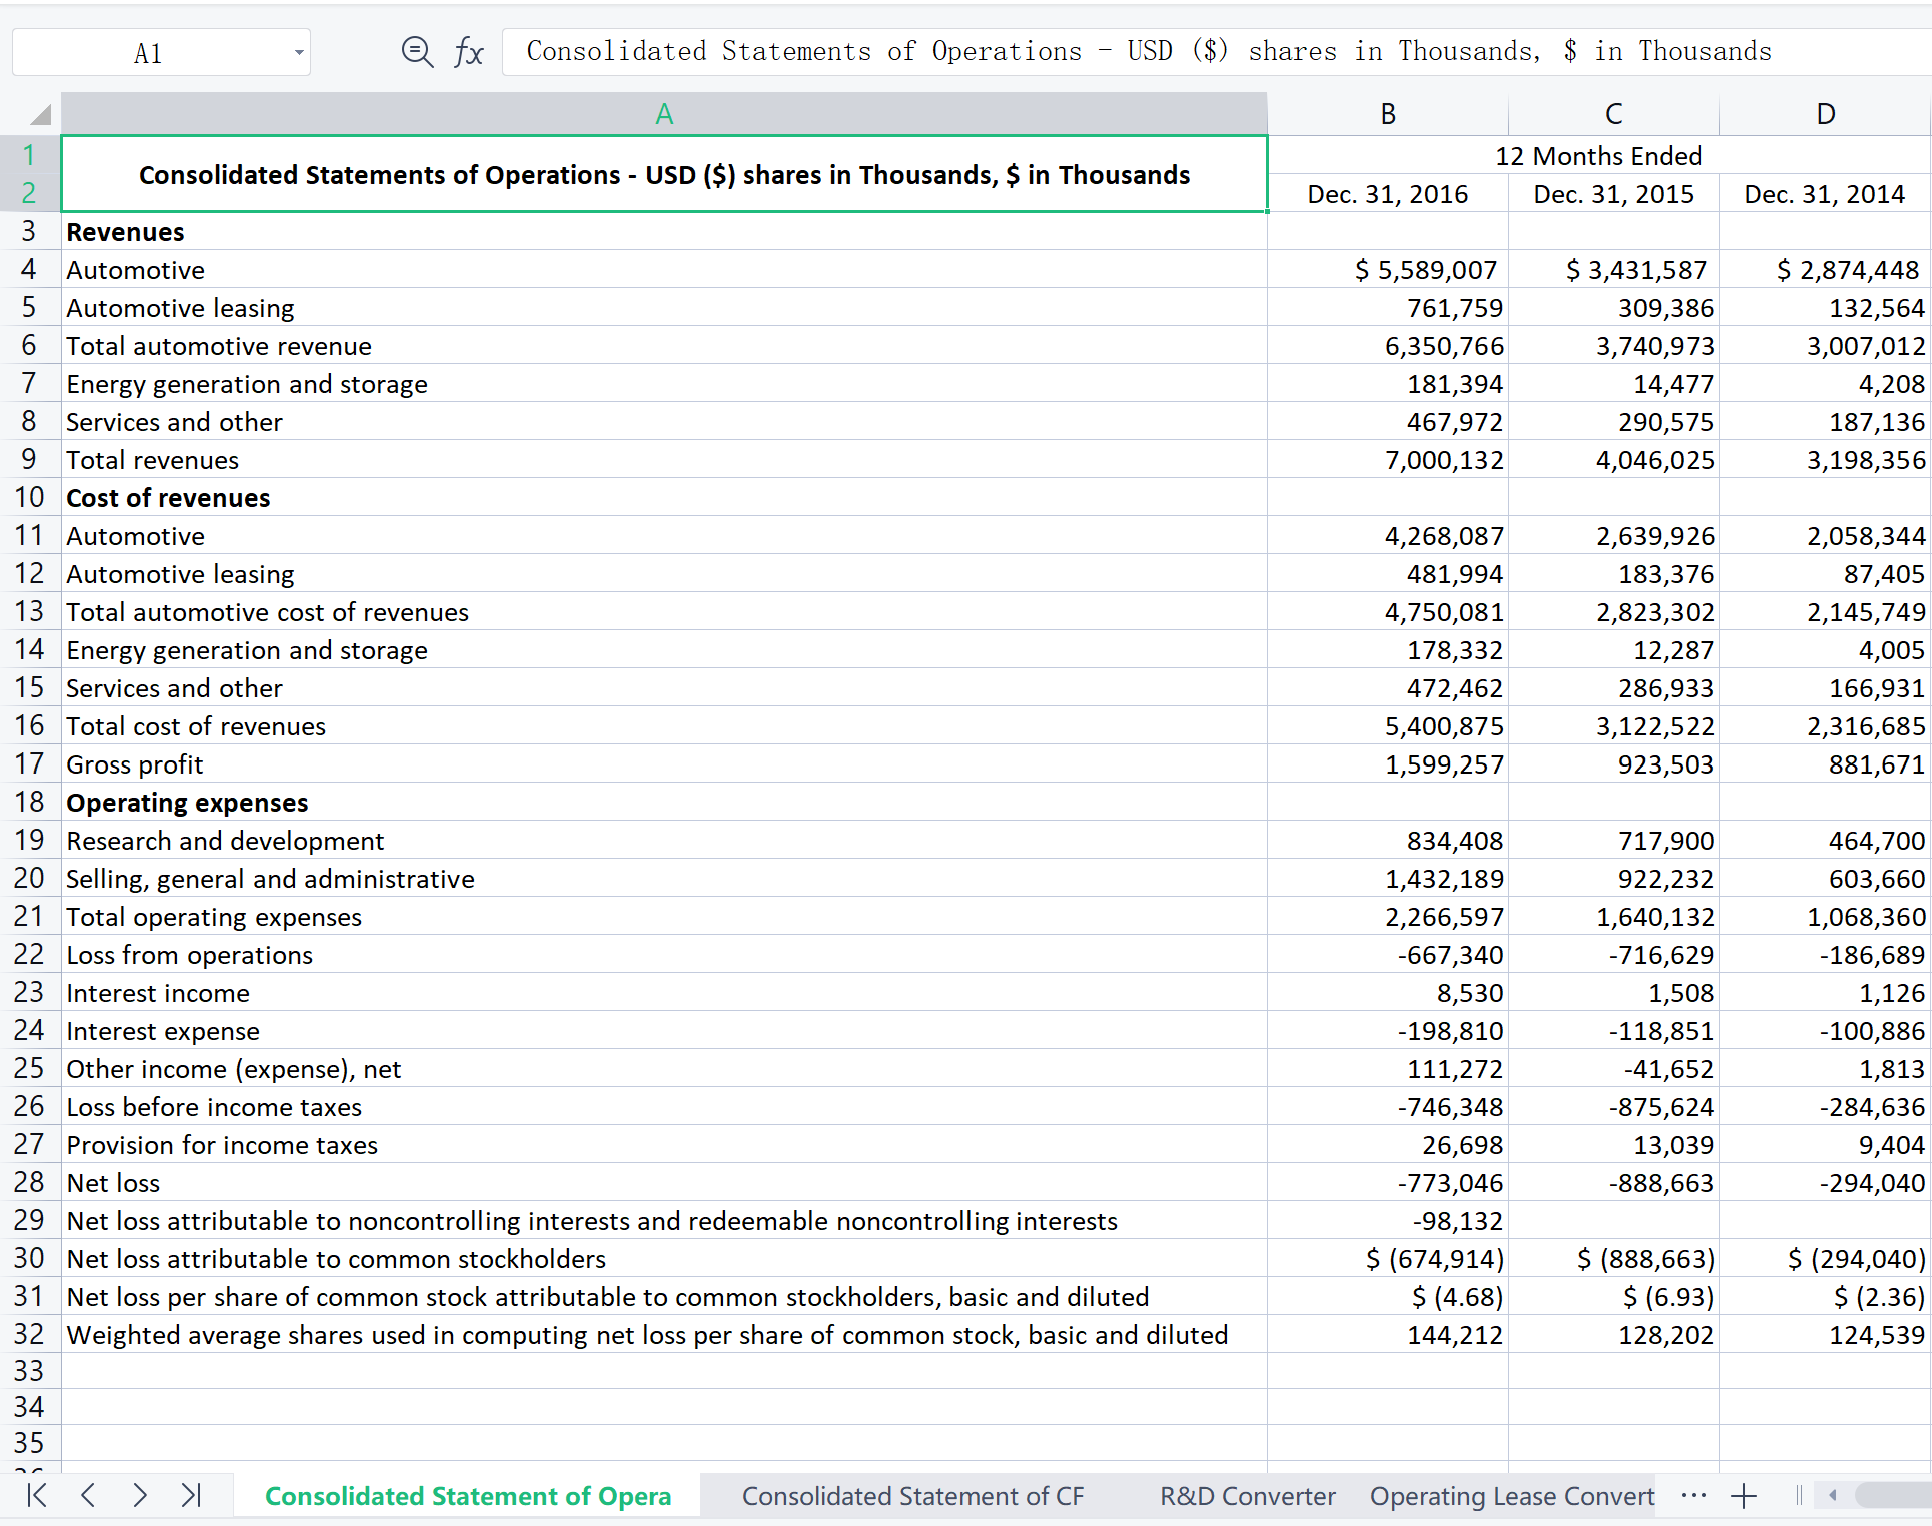
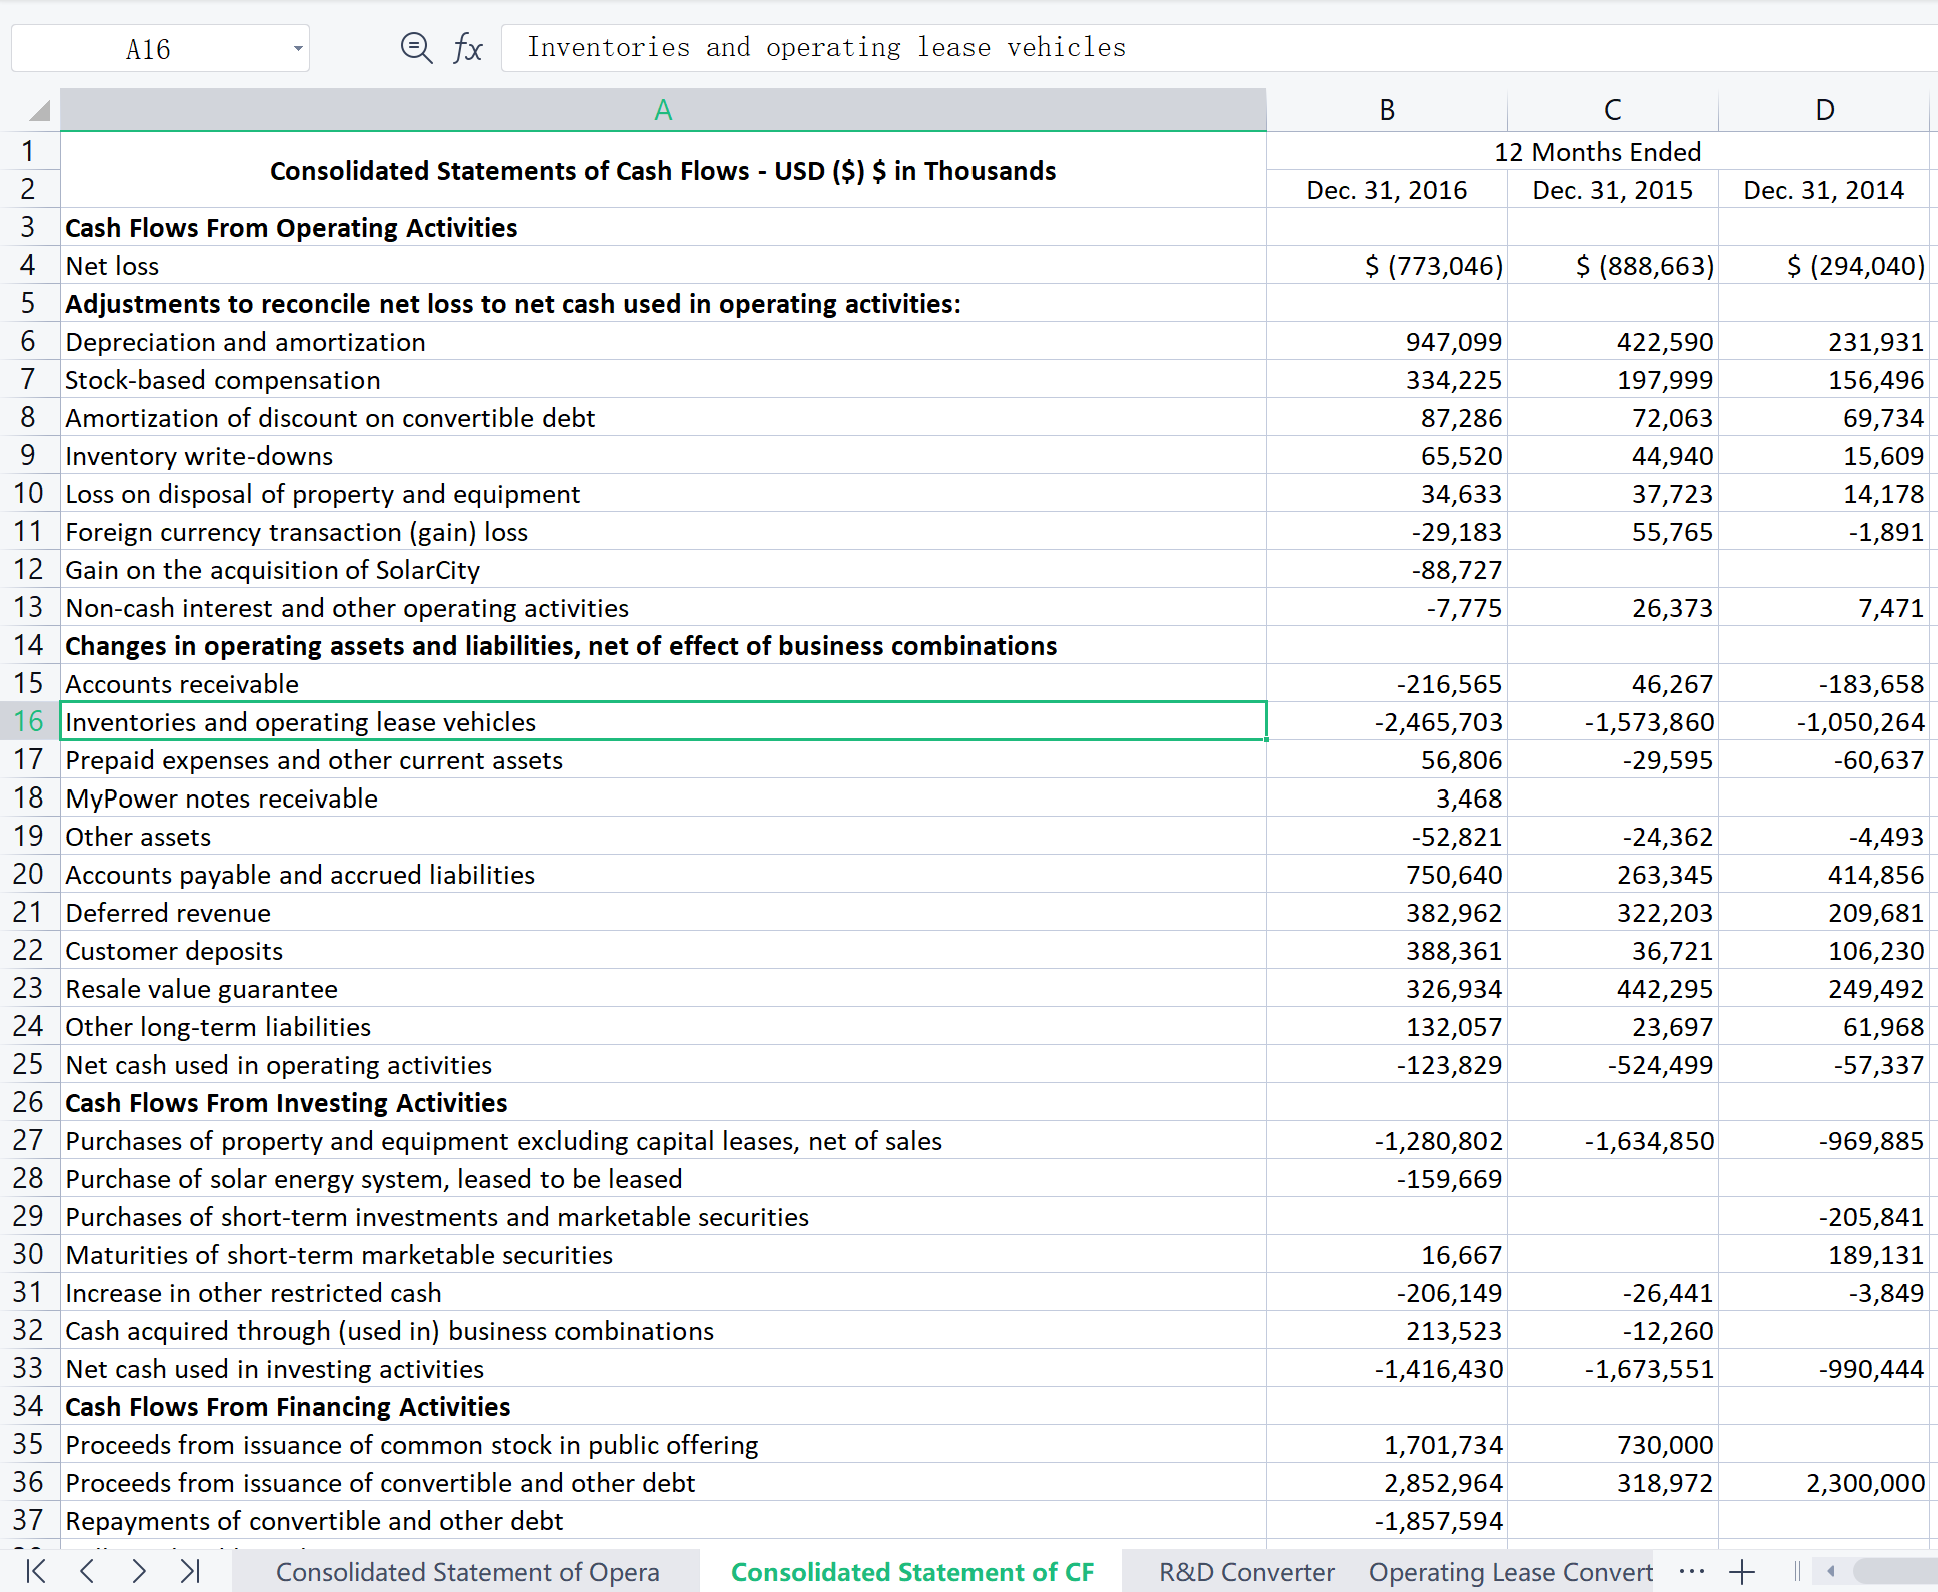
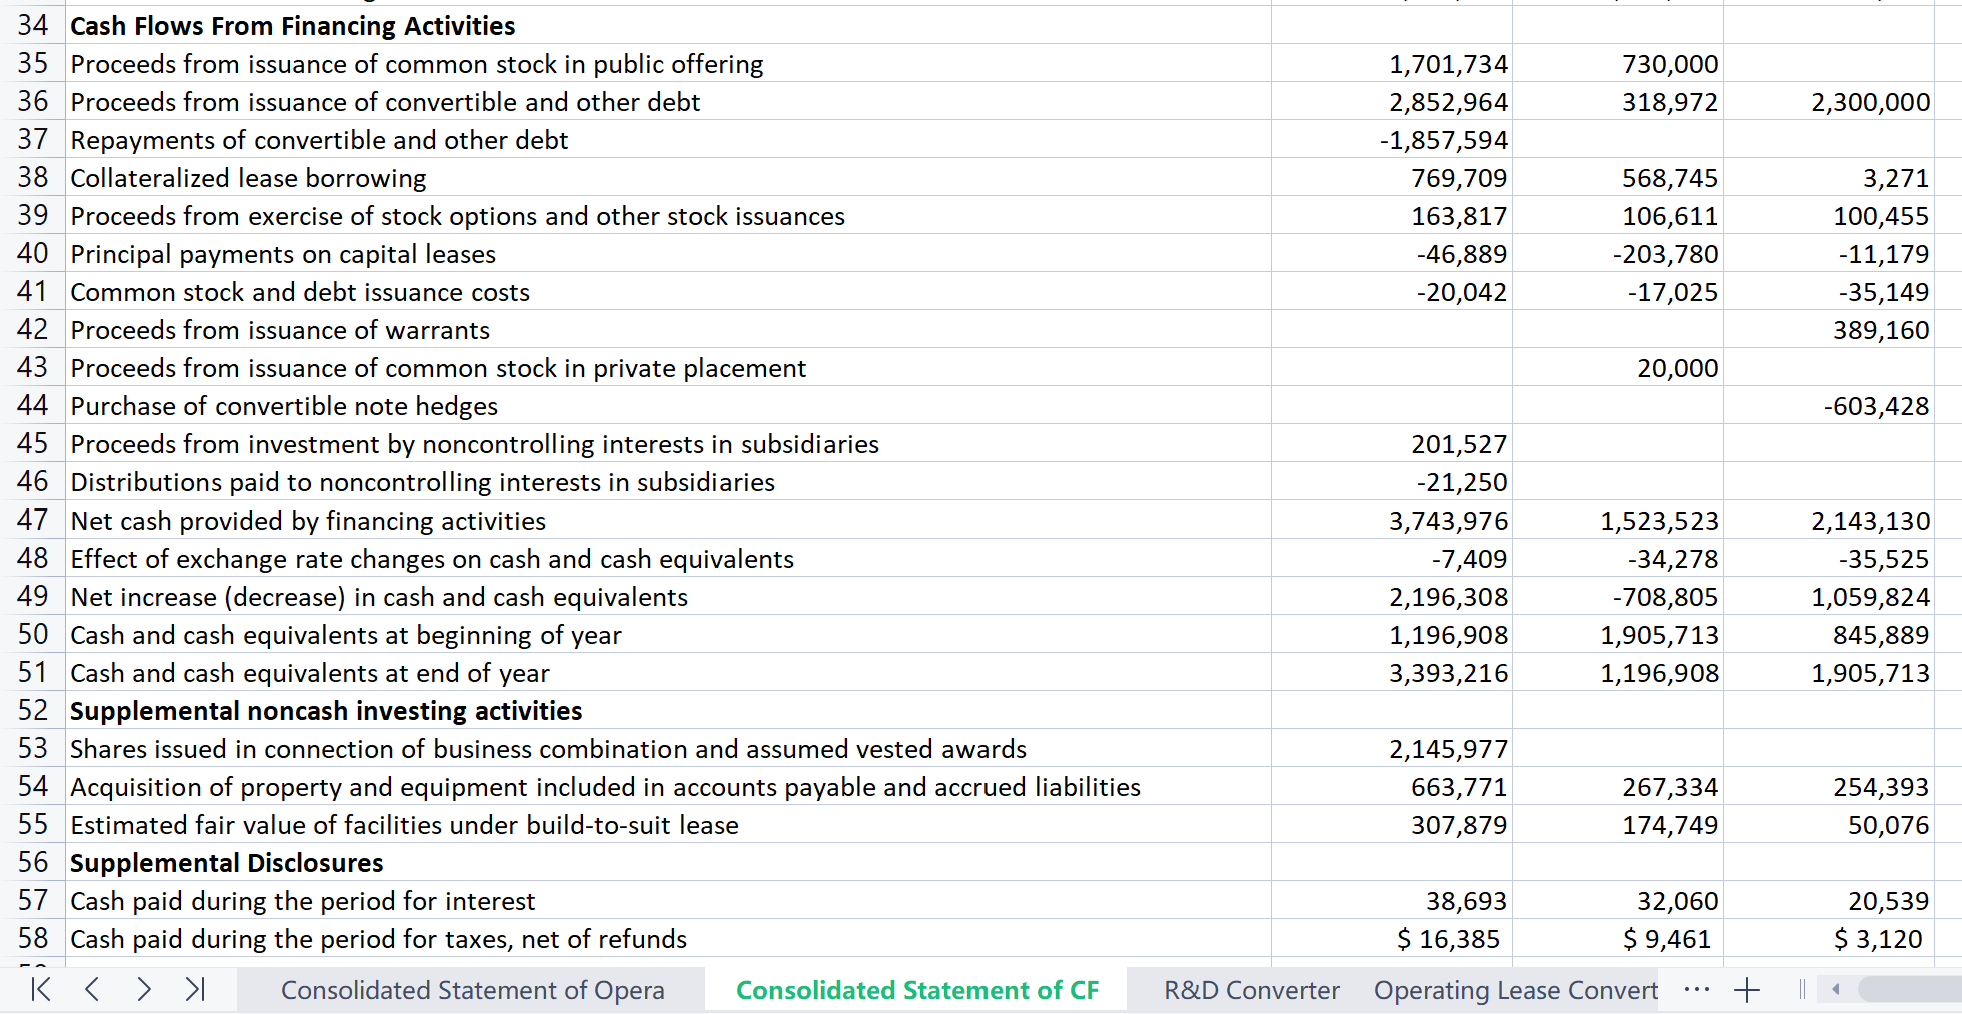
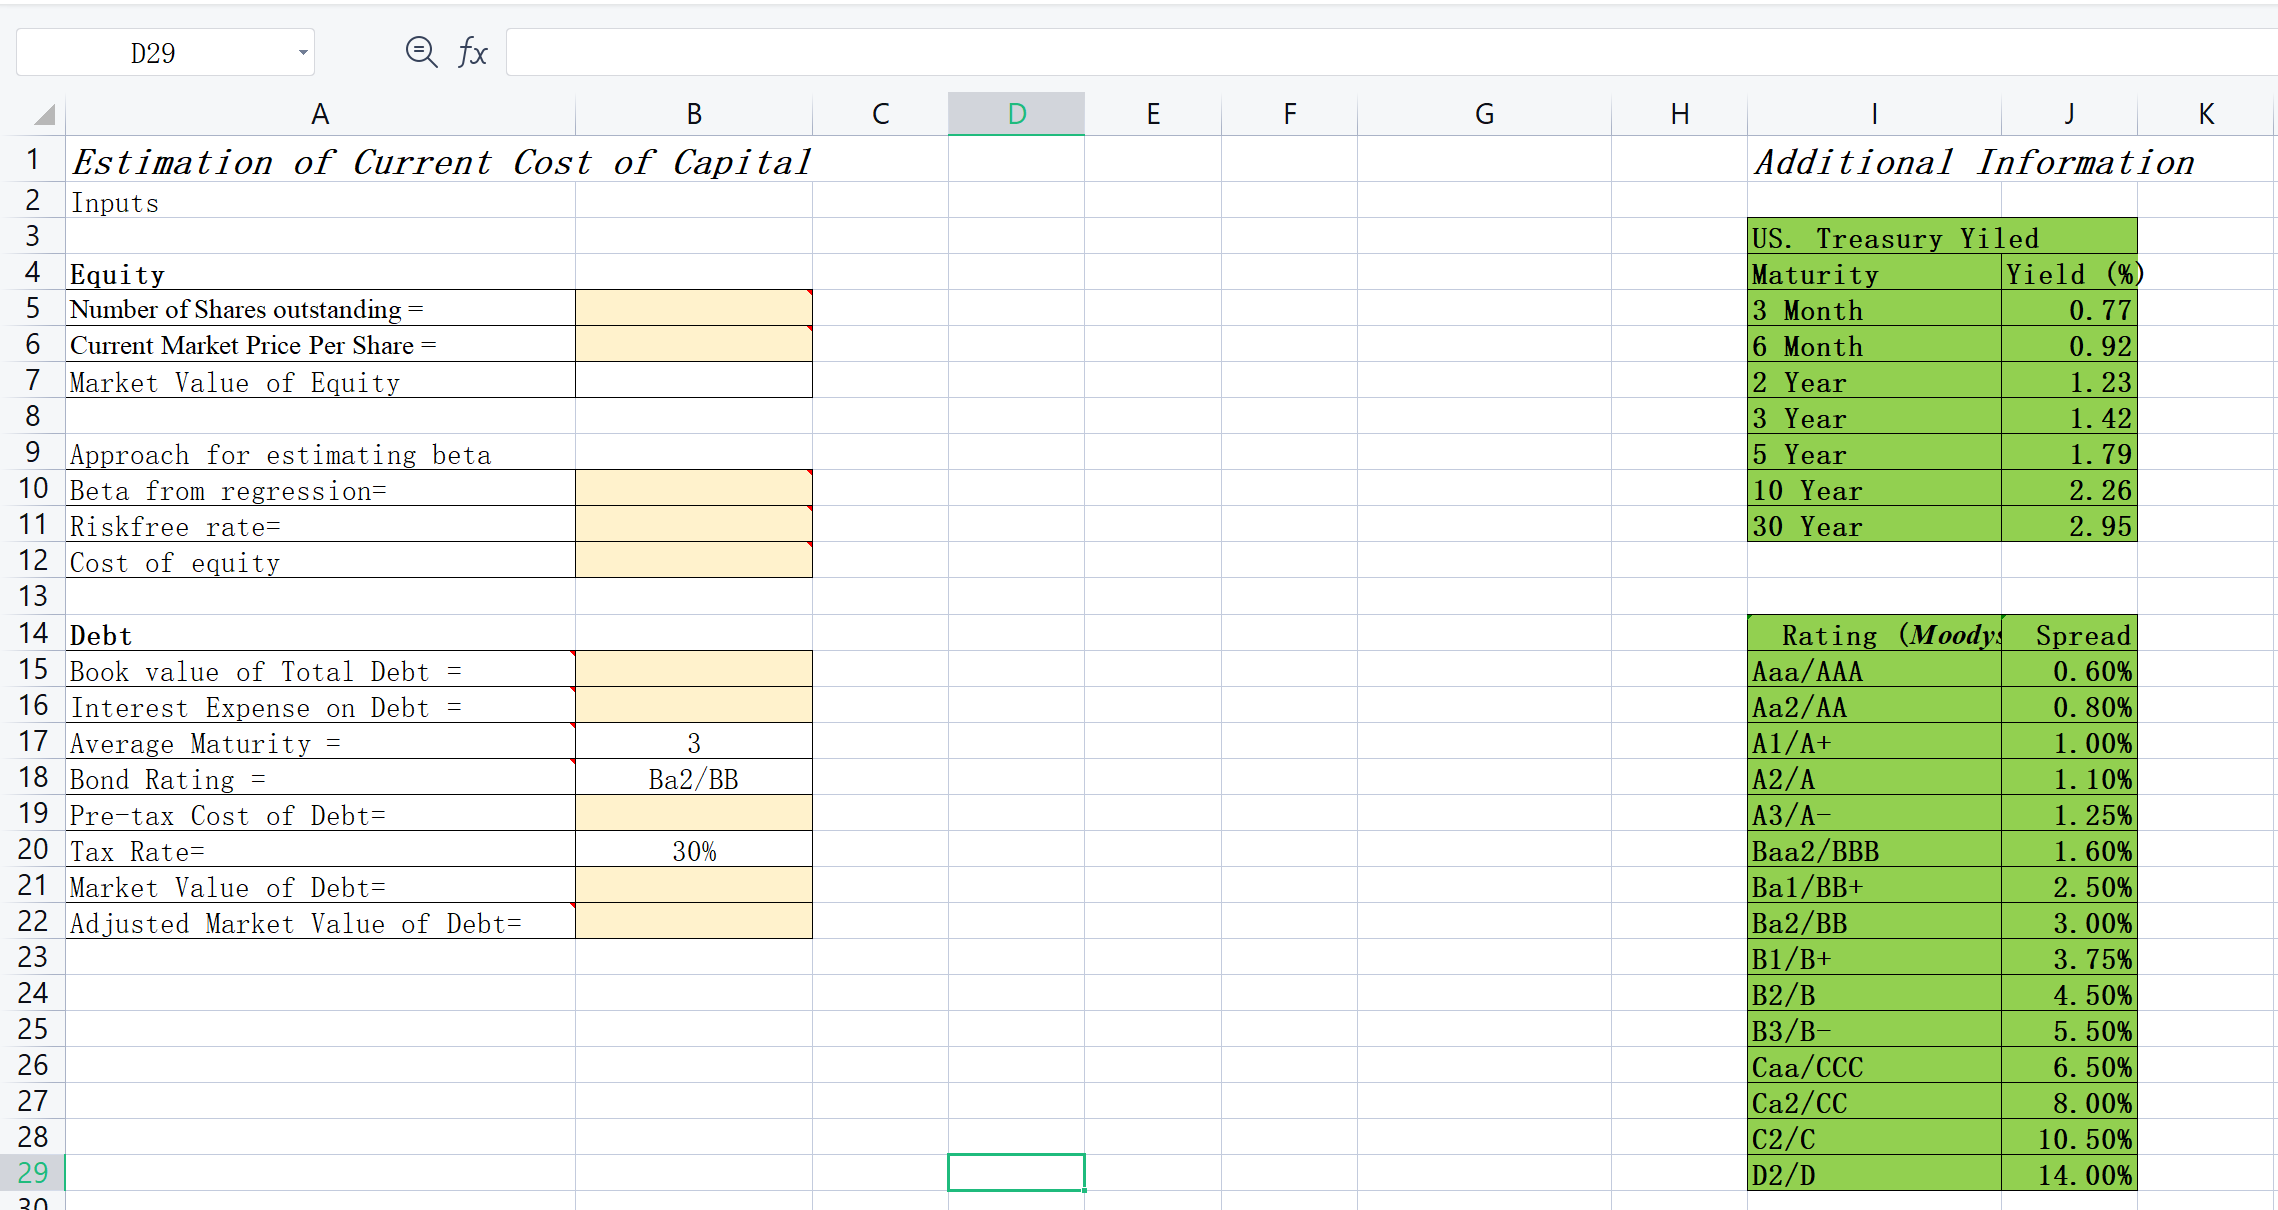
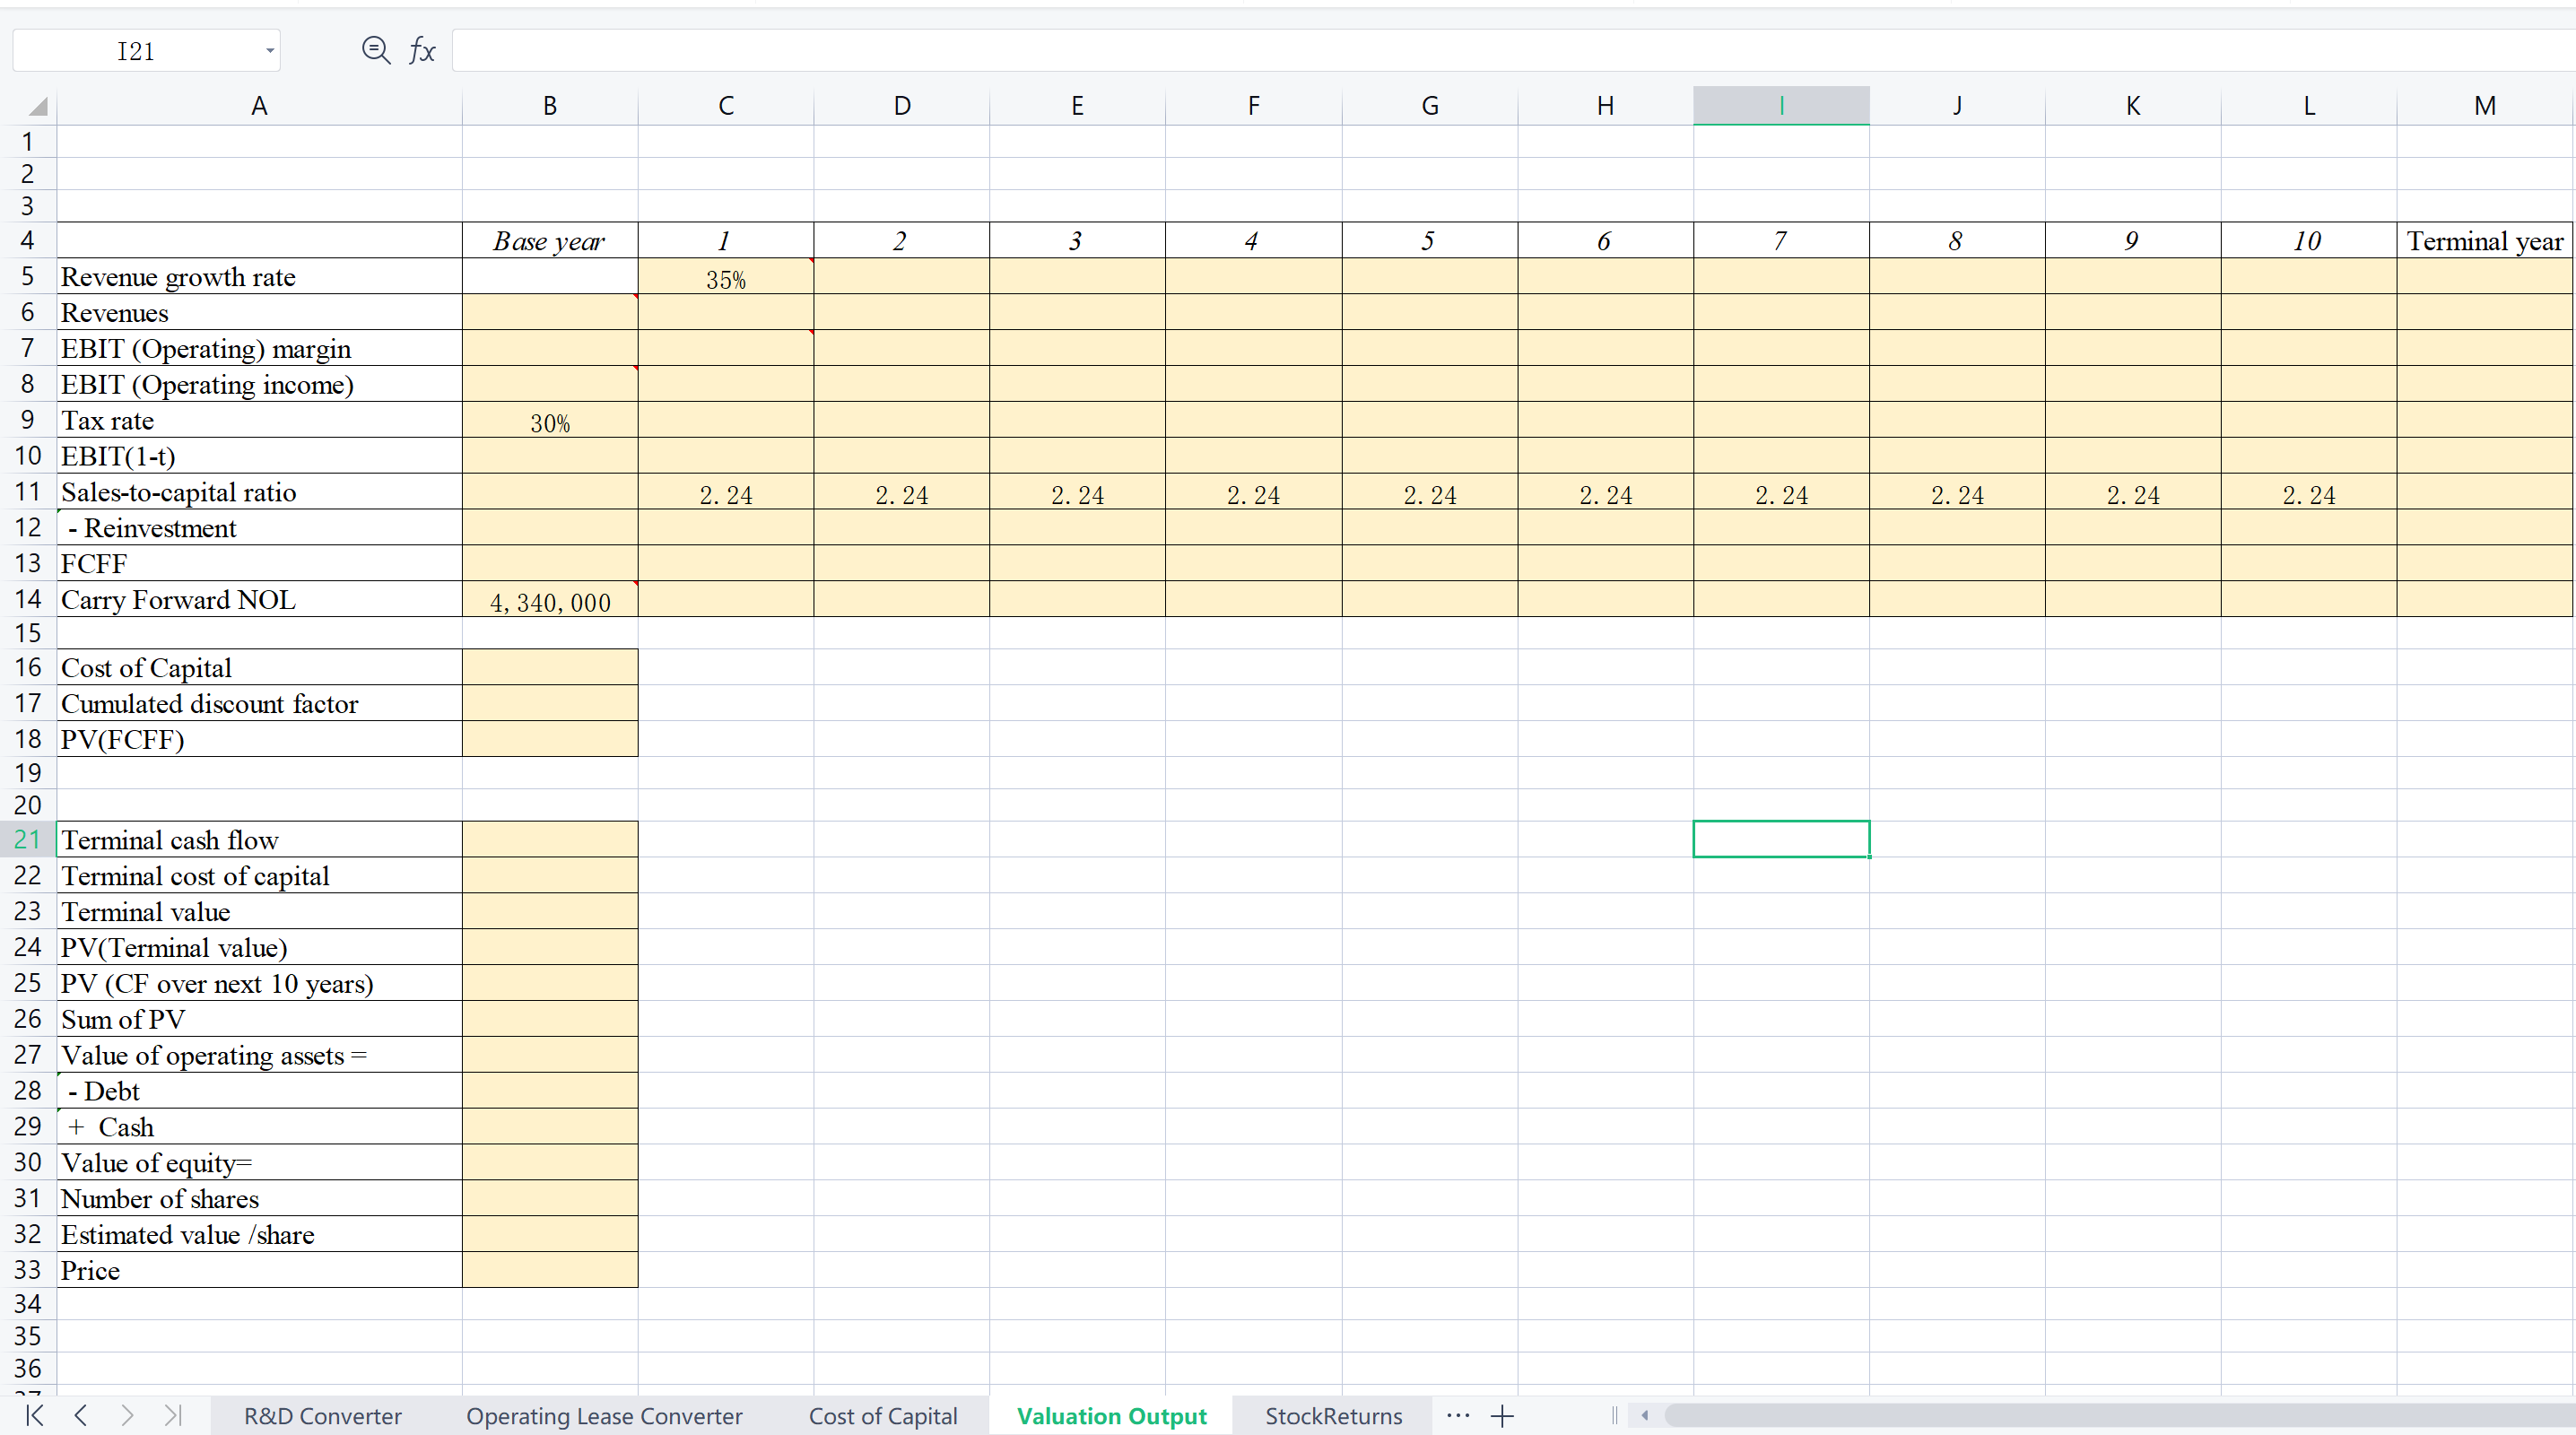
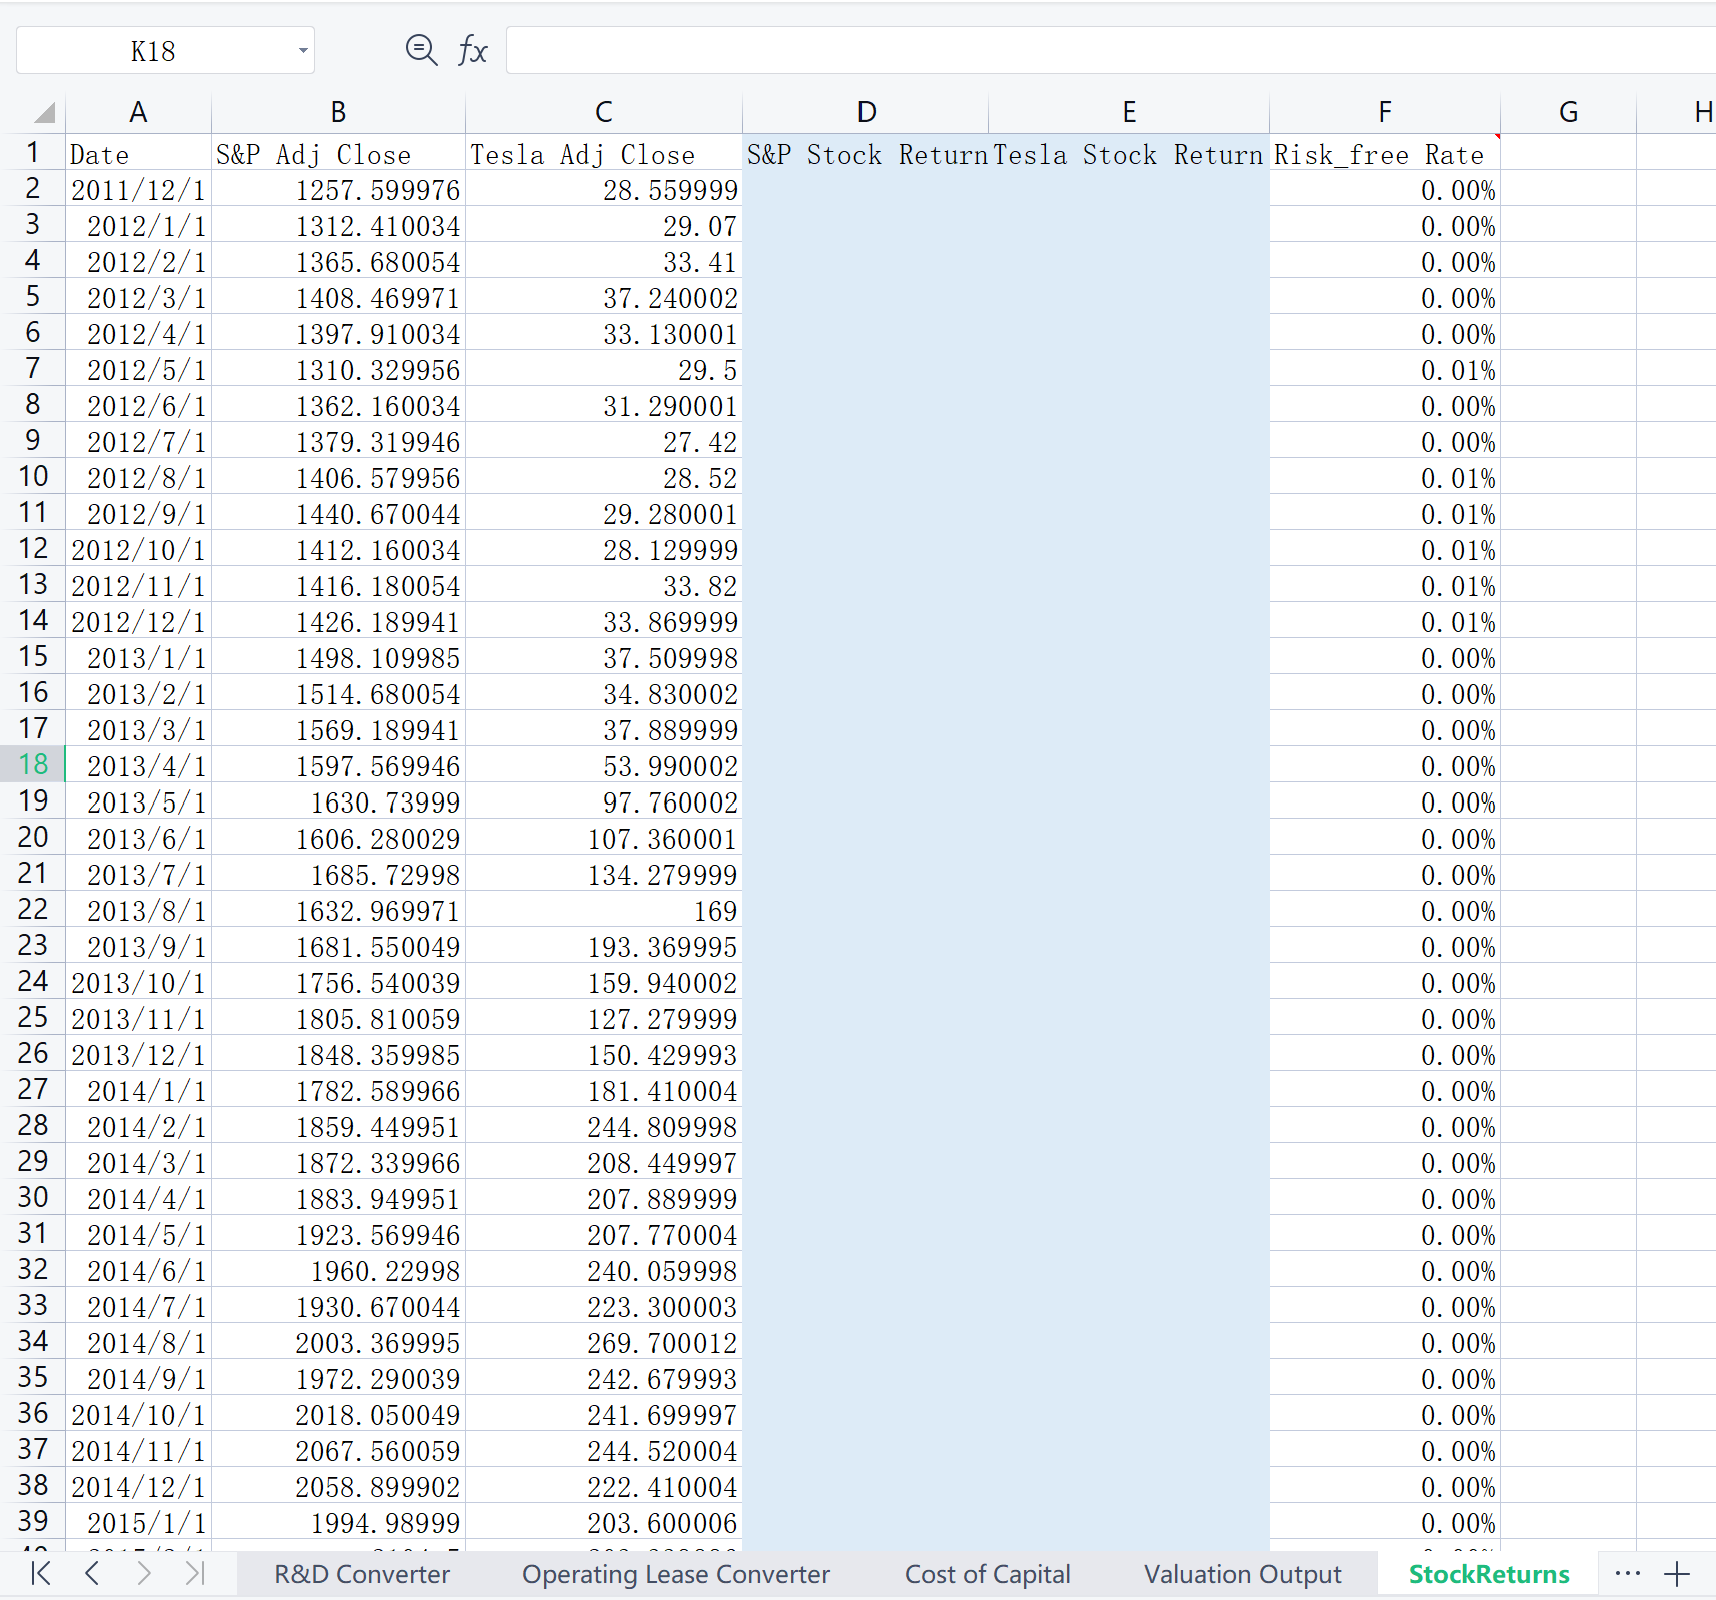
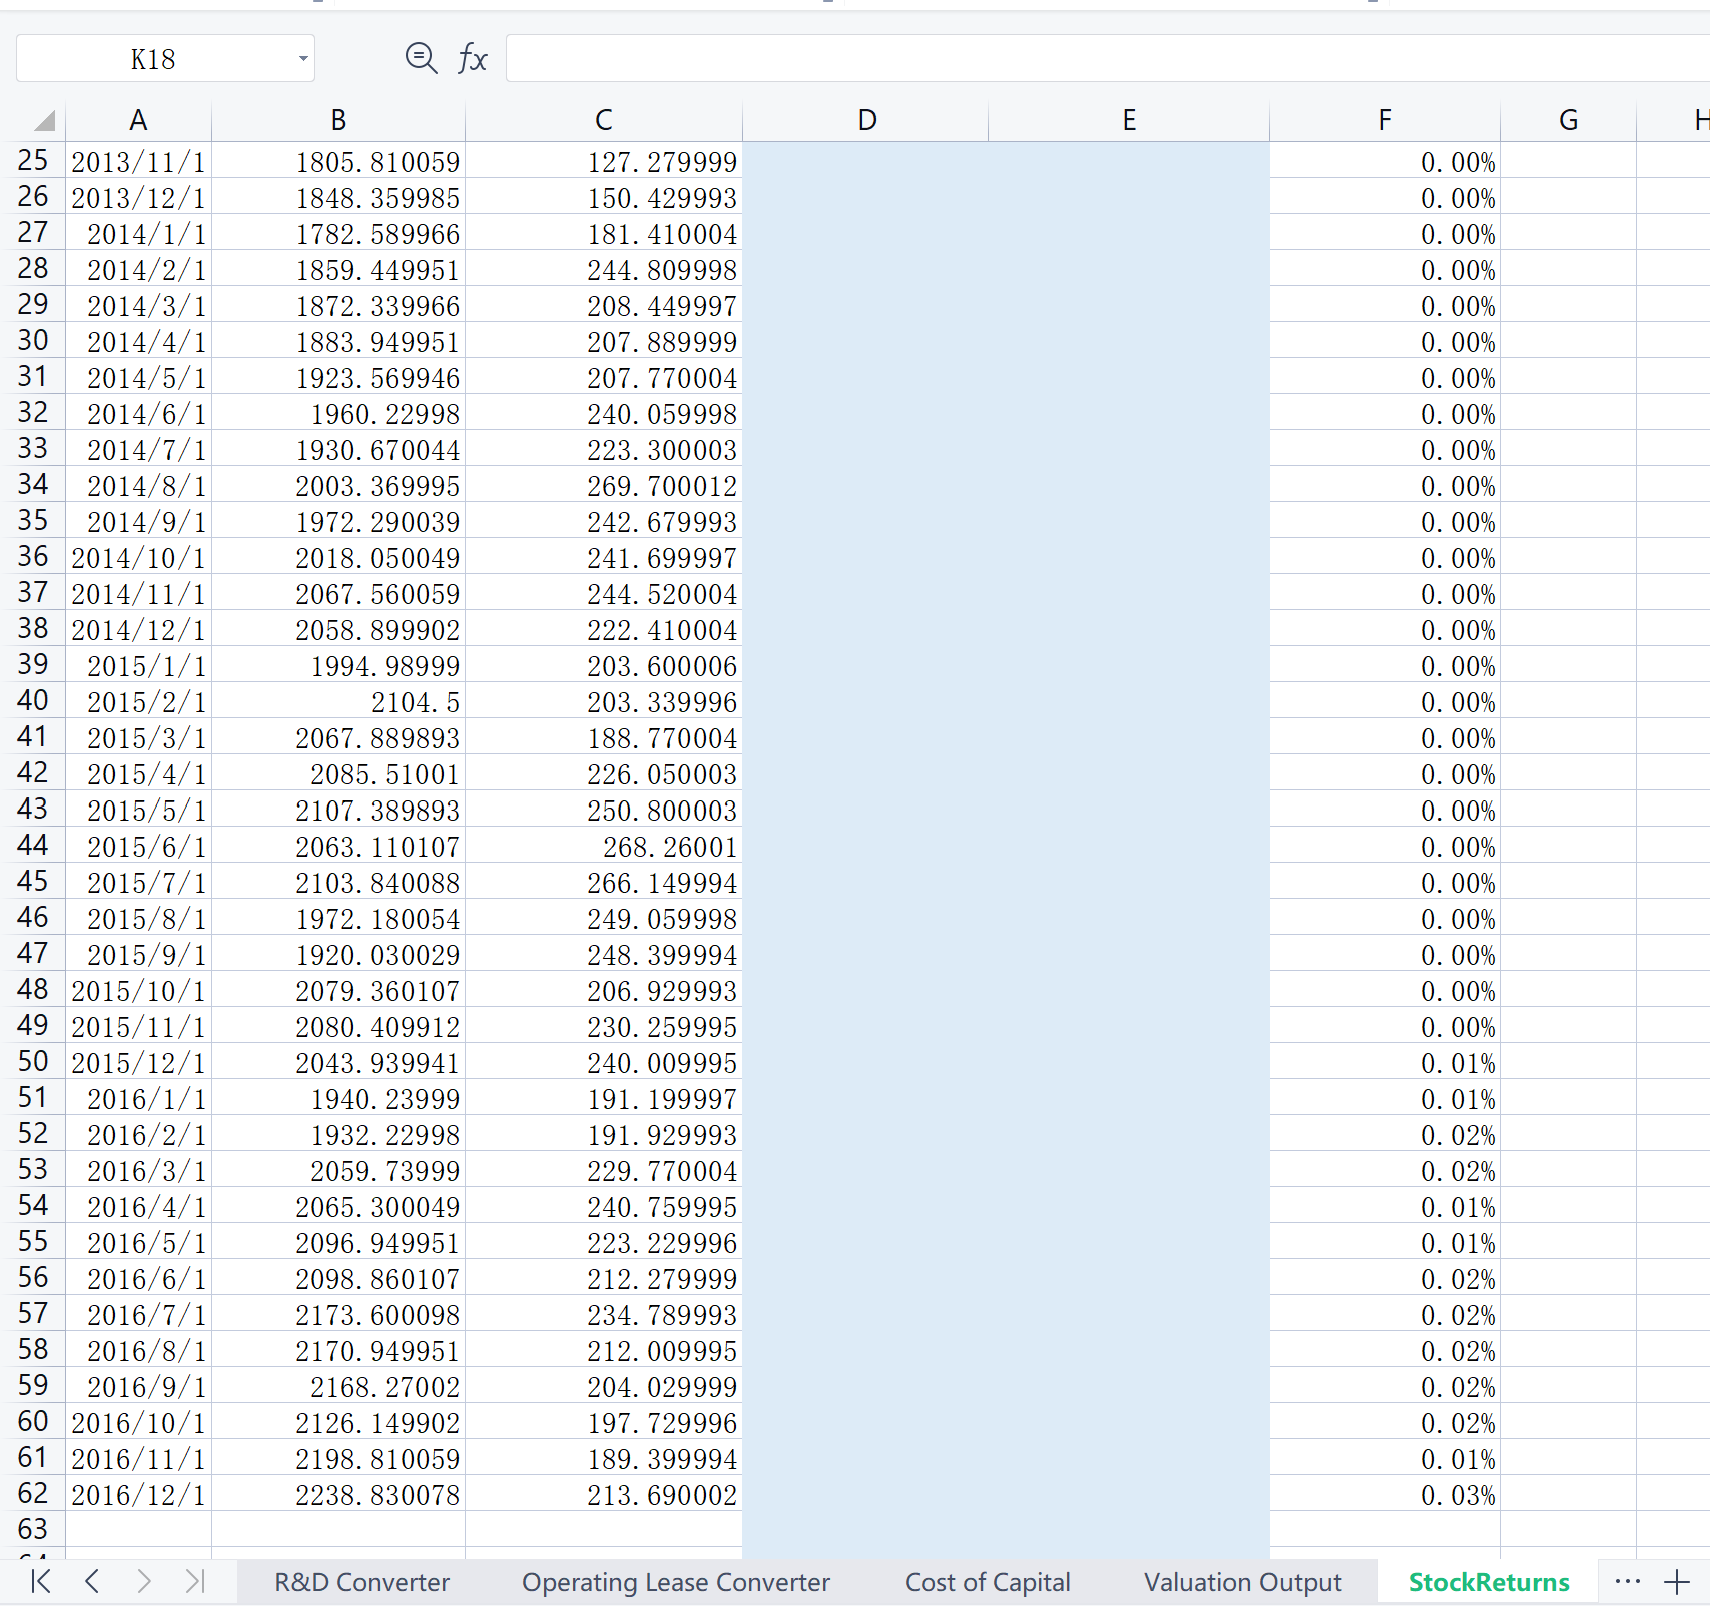
A QOONOWW-bUJNI N _\\ _\\ _\\ _\\ _\\ _\\ _\\ _\\ _\\ _\\ )Olm)\"ld)')'\")t)'\")\")\")o) [\\J _\\ N N [\\J UJ N 4:. 25_ 251 27_ 281 297 39 317 327 337 347 357 T >| Consolidated Statement of Opera Consolidated Statement of CF R8LD Converter B , c , D 12 Months Ended Dec. 31, 2015 Dec. 31, 2014 5 5,589,007 5 3,431,587 5 2,874,448 761,759 309,386 132,564 6,350,766 3,740,973 3,007,012 181,394 14,477 4,208 467,972 290,575 187,136 7,000,132 4,046,025 3,198,356 4,268,087 2,639,925 2,058,344 481,994 183,375 87,405 4,750,081 2,823,302 2,145,749 178,332 12,287 4,005 472,462 286,933 166,931 5,400,875 3,122,522 2,316,685 1,599,257 923,503 881,671 834,408 717,900 464,700 1,432,189 922,232 503,660 2,266,597 1,640,132 1,068,360 667,340 716,629 186,689 8,530 1,508 1,126 198,810 118,851 100,886 111,272 -41,652 1,813 746,348 875,624 284,636 26,698 13,039 9,404 773,046 888,663 294,040 -98,132 $ (674,914) $ (888,663) S (294,040) S (4.68) s (6.93) s (2.36) 144,212 128,202 124,539 Operating Lease Convert + A16 v a x Inventories and operating lease vehicles A A B , C , D 1 Consolidated Statements of Cash Flows - USD($) Sin Thousands 12 Months Ended 27 Dec. 31, 2016 Dec. 31, 2015 Dec. 31, 2014 3iCash Flows From Operating Activities 4_ Net loss 5 (773,046) 5 (888,663) 5 (294,040) SiAdjustments to reconcile net loss to net cash used in operating activities: 6* Depreciation and amortization 947,099 422,590 231,931 7_ Stock-based compensation 334,225 197,999 156,496 87Amortization of discount on convertible debt 87,286 72,063 69,734 9* Inventory write-downs 65,520 44,940 15,609 107 Loss on disposal of property and equipment 34,633 37,723 14,178 1L Foreign currency transaction (gain) loss 29,183 55,765 1,891 12* Gain on the acquisition of SolarCity -88,727 137 Noncash interest and other operating activities 7,775 26,373 7,471 14* Changes in operating assets and liabilities, net of effect of business combinations 15 Accounts receivable -216,565 46,267 -183,658 16 Ilnventories and operating lease vehicles I 2,465,703 1,573,860 1,050,264 17* Prepaid expenses and other current assets 56,806 29,595 60,637 187 MyPower notes receivable 3,468 197 Other assets 52,821 24,362 4,493 20_Accounts payable and accrued liabilities 750,640 263,345 414,856 2L Deferred revenue 382,962 322,203 209,681 22* Customer deposits 388,361 36,721 106,230 23_ Resale value guarantee 326,934 442,295 249,492 247 Other longterm liabilities 132,057 23,697 61,968 25* Net cash used in operating activities 123,829 524,499 57,337 267 Cash Flows From Investing Activities 277 Purchases of property and equipment excluding capital leases, net of sales 1,280,802 1,634,850 969,885 28* Purchase of solar energy system, leased to be leased -159,669 297 Purchases of shortterm investments and marketable securities 205,841 307 Maturities of shortterm marketable securities 16,667 189,131 31_ Increase in other restricted cash -206,149 -26,441 -3,849 327 Cash acquired through (used in) business combinations 213,523 12,260 33* Net cash used in investing activities 1,416,430 1,673,551 990,444 34_ Cash Flows From Financing Activities 357 Proceeds from issuance of common stock in public offering 1,701,734 730,000 36* Proceeds from issuance of convertible and other debt 2,852,964 318,972 2,300,000 37* Repayments of convertible and other debt 4,857,594 K >| Consolidated Statement of Opera Consolidated Statement of CF RSLD Converter Operating Lease Convert + H i 34 35 36 37 38 39 40 41 42 43 44 45 46 47 48 49 50 51 52 53 54 55 56 57 58* K Cash Flows From Financing Activities Proceeds from issuance of common stock in public offering Proceeds from issuance of convertible and other debt Repayments of convertible and other debt Collateralized lease borrowing Proceeds from exercise of stock options and other stock issuances Principal payments on capital leases Common stock and debt issuance costs Proceeds from issuance of warrants Proceeds from issuance of common stock in private placement Purchase of convertible note hedges Proceeds from investment by noncontrolling interests in subsidiaries Distributions paid to noncontrolling interests in subsidiaries Net cash provided by financing activities Effect of exchange rate changes on cash and cash equivalents Net increase (decrease) in cash and cash equivalents Cash and cash equivalents at beginning of year Cash and cash equivalents at end of year Supplemental noncash investing activities Shares issued in connection of business combination and assumed vested awards Acquisition of property and equipment included in accounts payable and accrued liabilities Estimated fair value of facilities under buildtosuit lease Supplemental Disclosures Cash paid during the period for interest Cash paid during the period for taxes, net of refunds >| Consolidated Statement of Opera Consolidated Statement of CF R8LD Converter 1,701,734 2,852,964 4,857,594 769,709 163,817 -46,889 -20,042 201,527 -21,250 3,743,976 -7,409 2,196,308 1,196,908 3,393,216 2,145,977 663,771 307,879 38,693 5 16,385 730,000 318,972 568,745 106,611 -203,780 -17,025 20,000 1,523,523 -34,278 708,805 1,905,713 1,196,908 267,334 174,749 32,060 5 9,461 Operating Lease Convert 2,300,000 3,271 100,455 -11,179 -35,149 389,160 603,428 2,143,130 -35,525 1,059,824 845,889 1,905,713 254,393 50,076 20,539 5 3,120 G16 v Q fx A A B C D ' E F G H J K L M 17 R & D Converter 27 The yellow cells are input cells. Please enter them. 3, This spreadsheet converts R&D expenses from operating to capital expenses. It makes the appropriate adjustments to operating income, net 4, income, the book value of assets and the book value of equity. 5 6, Inputs 7, Over how many years do you want to amortize R&D expenses 5 ! we assume the amortization years, notmally the maximum is 10 years 87 The current year's R&D expense : 9, Enter R& D expenses for past years: the number of years that you will need to enter will be determined by the amortization period 10 Do not input numbers in the rst column (Year). It will get automatically updated based on the input above. 11 Year R& D Expenses 1 2 20 1 5 1 3 2014 14 2013 1 5 20 12 16 2011 _ 177 18 19 Year R&D Expense Unamortized portion Amortization this year 20 Current 21 *1 22 *2 23 *3 24 *4 25 *5 26 11118 of Research Assets 27 28 Amortization of asset for current year : 29 30 Adjushnent to Operating Income : .l A positive number indicates an increase in operating income (add to reported EBIT) 317 Tax Effect of R&D Expensing 327 337 347 357 367 377 38 K >| Consolidated Statement of Opera Consolidated Statement of CF R&D Converter Operating Lease Convert + H ' B23 @ fx A B C D E F G H Operating Lease Converter N The yellow cells are input cells. Please enter them. w Inputs Operating Lease Commitments (From footnote to financials) Year Commitment DOO VOUID 2016 (Current Year) 2017 9 2019 10 2020 11 2021 12 Thereafter 13 14 Pre-tax Cost of Debt= 15 16 Number of Years Embedded in Thereafter estimate 17 18 Coverting Opearting Leases into debt 19 20 Year Commitment Present value 21 2017 22 2018 23 2019 24 2020 25 2021 26 Thereafter ! Commitment beyond year 6 converted into an annuity 27 Debt value of leases = 28 29 30 Restated Financials 31 Operating Lease Expense in Current year 32 Depreciation on Operating Lease Asset = use straight line depreciation 33 Adjustment to Operating Earnings = ! Add this amount to pre-tax operating income (EBIT) 34 Adjustment to Total Debt outstanding ! Add this amount to debt 35 36 37 38 20 K > Consolidated Statement of CF R&D Converter Operating Lease Converter Cost of Capital Valuation C ... + 1| 4D29 @ fx A B C D E F G H K 1 Estimation of Current Cost of Capital Additional Information Inputs W N US. Treasury Yiled 4 Equity Maturity Yield (%) 5 Number of Shares outstanding = 3 Month 0. 77 6 Current Market Price Per Share = 6 Month 0. 92 7 Market Value of Equity 2 Year 1. 23 8 3 Year 1. 42 Approach for estimating beta 5 Year 1 . 79 10 Beta from regression= 10 Year 2. 26 11 Riskfree rate= 30 Year 2. 95 12 Cost of equity 13 14 Debt Rating (Moodys Spread 15 Book value of Total Debt = Aaa/AAA 0. 60% 16 Interest Expense on Debt = Aa2/AA 0. 80% 17 Average Maturity = 3 A1 / A+ 1. 00% 18 Bond Rating = Ba2/BB A2/A 1. 10% 19 Pre-tax Cost of Debt= A3/A- 1. 25% 20 Tax Rate= 30% Baa2/BBB 1. 60% 21 Market Value of Debt= Bal/BB+ 2. 50% 22 Adjusted Market Value of Debt= Ba2/BB 3. 00% 23 B1 /B+ 3. 75% 24 B2/B 4. 50% 25 B3/B 5. 50% 26 Caa/CCC 6. 50% 27 Ca2/CC 8. 00% 28 C2/C 10. 50% 29 D2/D 14. 00%121 @ fx A B C D E TI G H I L K L M Base year 2 3 4 5 6 7 8 9 10 Terminal year VOUAWN Revenue growth rate 35% Revenues EBIT (Operating) margin 8 EBIT (Operating income) 9 Tax rate 30% 10 EBIT(1-t) 11 Sales-to-capital ratio 2. 24 2. 24 2. 24 2. 24 2. 24 2. 24 2. 24 2. 24 2. 24 2. 24 12 - Reinvestment 13 FCFF 14 Carry Forward NOL 4, 340, 000 15 16 Cost of Capital 17 Cumulated discount factor 18 PV(FCFF) 19 20 21 Terminal cash flow 22 Terminal cost of capital 23 Terminal value 24 PV(Terminal value) 25 PV (CF over next 10 years) 26 Sum of PV 27 Value of operating assets = 28 - Debt 29 + Cash 30 Value of equity= 31 Number of shares 32 Estimated value /share 33 Price 34 35 36 K > >1 R&D Converter Operating Lease Converter Cost of Capital Valuation Output StockReturns ... +K18 Q fx A B C D E F G Date S&P Adj Close Tesla Adj Close S&P Stock Return Tesla Stock Return Risk_free Rate 2011/12/1 1257. 599976 28. 559999 0. 00% 2012/1/1 1312. 410034 29. 07 0. 00% 1 A W 2012/2/1 1365. 680054 33. 41 0. 00% 2012/3/1 1408. 469971 37. 240002 0. 00% 2012/4/1 1397. 910034 33. 130001 0. 00% 2012/5/1 1310. 329956 29. 5 0. 01% 2012/6/1 1362. 160034 31. 290001 0. 00% 1 00 2012/7/1 1379. 319946 27. 42 0. 00% 10 2012/8/1 1406. 579956 28. 52 0. 01% 11 2012/9/1 1440. 670044 29. 280001 0. 01% 12 2012/10/1 1412. 160034 28. 129999 0. 01% 13 2012/11/1 1416. 180054 33. 82 0. 01% 14 2012/12/1 1426. 189941 33. 869999 0. 01% 15 2013/1/1 1498. 109985 37. 509998 0. 00% 16 2013/2/1 1514. 680054 34. 830002 0. 00% 17 2013/3/1 1569. 189941 37. 889999 0. 00% 18 2013/4/1 1597. 569946 53. 990002 0. 00% 19 2013/5/1 1630. 73999 97. 760002 0. 00% 20 2013/6/1 1606. 280029 107. 360001 0. 00% 21 2013/7/1 1685. 72998 134. 279999 0. 00% 22 2013/8/1 1632. 969971 169 0. 00% 23 2013/9/1 1681. 550049 193. 369995 0. 00% 24 2013/10/1 1756. 540039 159. 940002 0. 00% 25 2013/11/1 1805. 810059 127. 279999 0. 00% 26 2013/12/1 1848. 359985 150. 429993 0. 00% 27 2014/1/1 1782. 589966 181. 410004 0. 00% 28 2014/2/1 1859. 449951 244. 809998 0. 00% 29 2014/3/1 1872. 339966 208. 449997 0. 00% 30 2014/4/1 1883. 949951 207. 889999 0. 00% 31 2014/5/1 1923. 569946 207. 770004 0. 00% 32 2014/6/1 1960. 22998 240. 059998 0. 00% 33 2014/7/1 1930. 670044 223. 300003 0. 00% 34 2014/8/1 2003. 369995 269. 700012 0. 00% 35 2014/9/1 1972. 290039 242. 679993 0. 00% 36 2014/10/1 2018. 050049 241. 699997 0. 00% 37 2014/11/1 2067. 560059 244. 520004 0. 00% 38 2014/12/1 2058. 899902 222. 410004 0. 00% 39 2015/1/1 1994. 98999 203. 600006 0. 00% K R&D Converter Operating Lease Converter Cost of Capital Valuation Output StockReturns ... +K18 @ fx A B C D E F G 25 2013/11/1 1805. 810059 127. 279999 0. 00% 26 2013/12/1 1848. 359985 150. 429993 0. 00% 27 2014/1/1 1782. 589966 181. 410004 0. 00% 28 2014/2/1 1859. 449951 244. 809998 0. 00% 29 2014/3/1 1872. 339966 208. 449997 0. 00% 30 2014/4/1 1883. 949951 207. 889999 0. 00% 31 2014/5/1 1923. 569946 207. 770004 0. 00% 32 2014/6/1 1960. 22998 240. 059998 0. 00% 33 2014/7/1 1930. 670044 223. 300003 0. 00% 34 2014/8/1 2003. 369995 269. 700012 0. 00% 35 2014/9/1 1972. 290039 242. 679993 0. 00% 36 2014/10/1 2018. 050049 241. 699997 0. 00% 37 2014/11/1 2067. 560059 244. 520004 0. 00% 38 2014/12/1 2058. 899902 222. 410004 0. 00% 39 2015/1/1 1994. 98999 203. 600006 0. 00% 40 2015/2/1 2104. 5 203. 339996 0. 00% 41 2015/3/1 2067. 889893 188. 770004 0. 00% 42 2015/4/1 2085. 51001 226. 050003 0. 00% 43 2015/5/1 2107. 389893 250. 800003 0. 00% 44 2015/6/1 2063. 110107 268. 26001 0. 00% 45 2015/7/1 2103. 840088 266. 149994 0. 00% 46 2015/8/1 1972. 180054 249. 059998 0. 00% 47 2015/9/1 1920. 030029 248. 399994 0. 00% 48 2015/10/1 2079. 360107 206. 929993 0. 00% 49 2015/11/1 2080. 409912 230. 259995 0. 00% 50 2015/12/1 2043. 939941 240. 009995 0. 01% 51 2016/1/1 1940. 23999 191. 199997 0. 01% 52 2016/2/1 1932. 22998 191. 929993 0. 02% 53 2016/3/1 2059. 73999 229. 770004 0. 02% 54 2016/4/1 2065. 300049 240. 759995 0. 01% 55 2016/5/1 2096. 949951 223. 229996 0. 01% 56 2016/6/1 2098. 860107 212. 279999 0. 02% 57 2016/7/1 2173. 600098 234. 789993 0. 02% 58 2016/8/1 2170. 949951 212. 009995 0. 02% 59 2016/9/1 2168. 27002 204. 029999 0. 02% 60 2016/10/1 2126. 149902 197. 729996 0. 02% 61 2016/11/1 2198. 810059 189. 399994 0. 01% 62 2016/12/1 2238. 830078 213. 690002 0. 03% 63 K > R&D Converter Operating Lease Converter Cost of Capital Valuation Output StockReturns ... +