

Question: A quality analyst wants to construct a control chart for determining whether four machines output from each machine in random samples, with the following results:
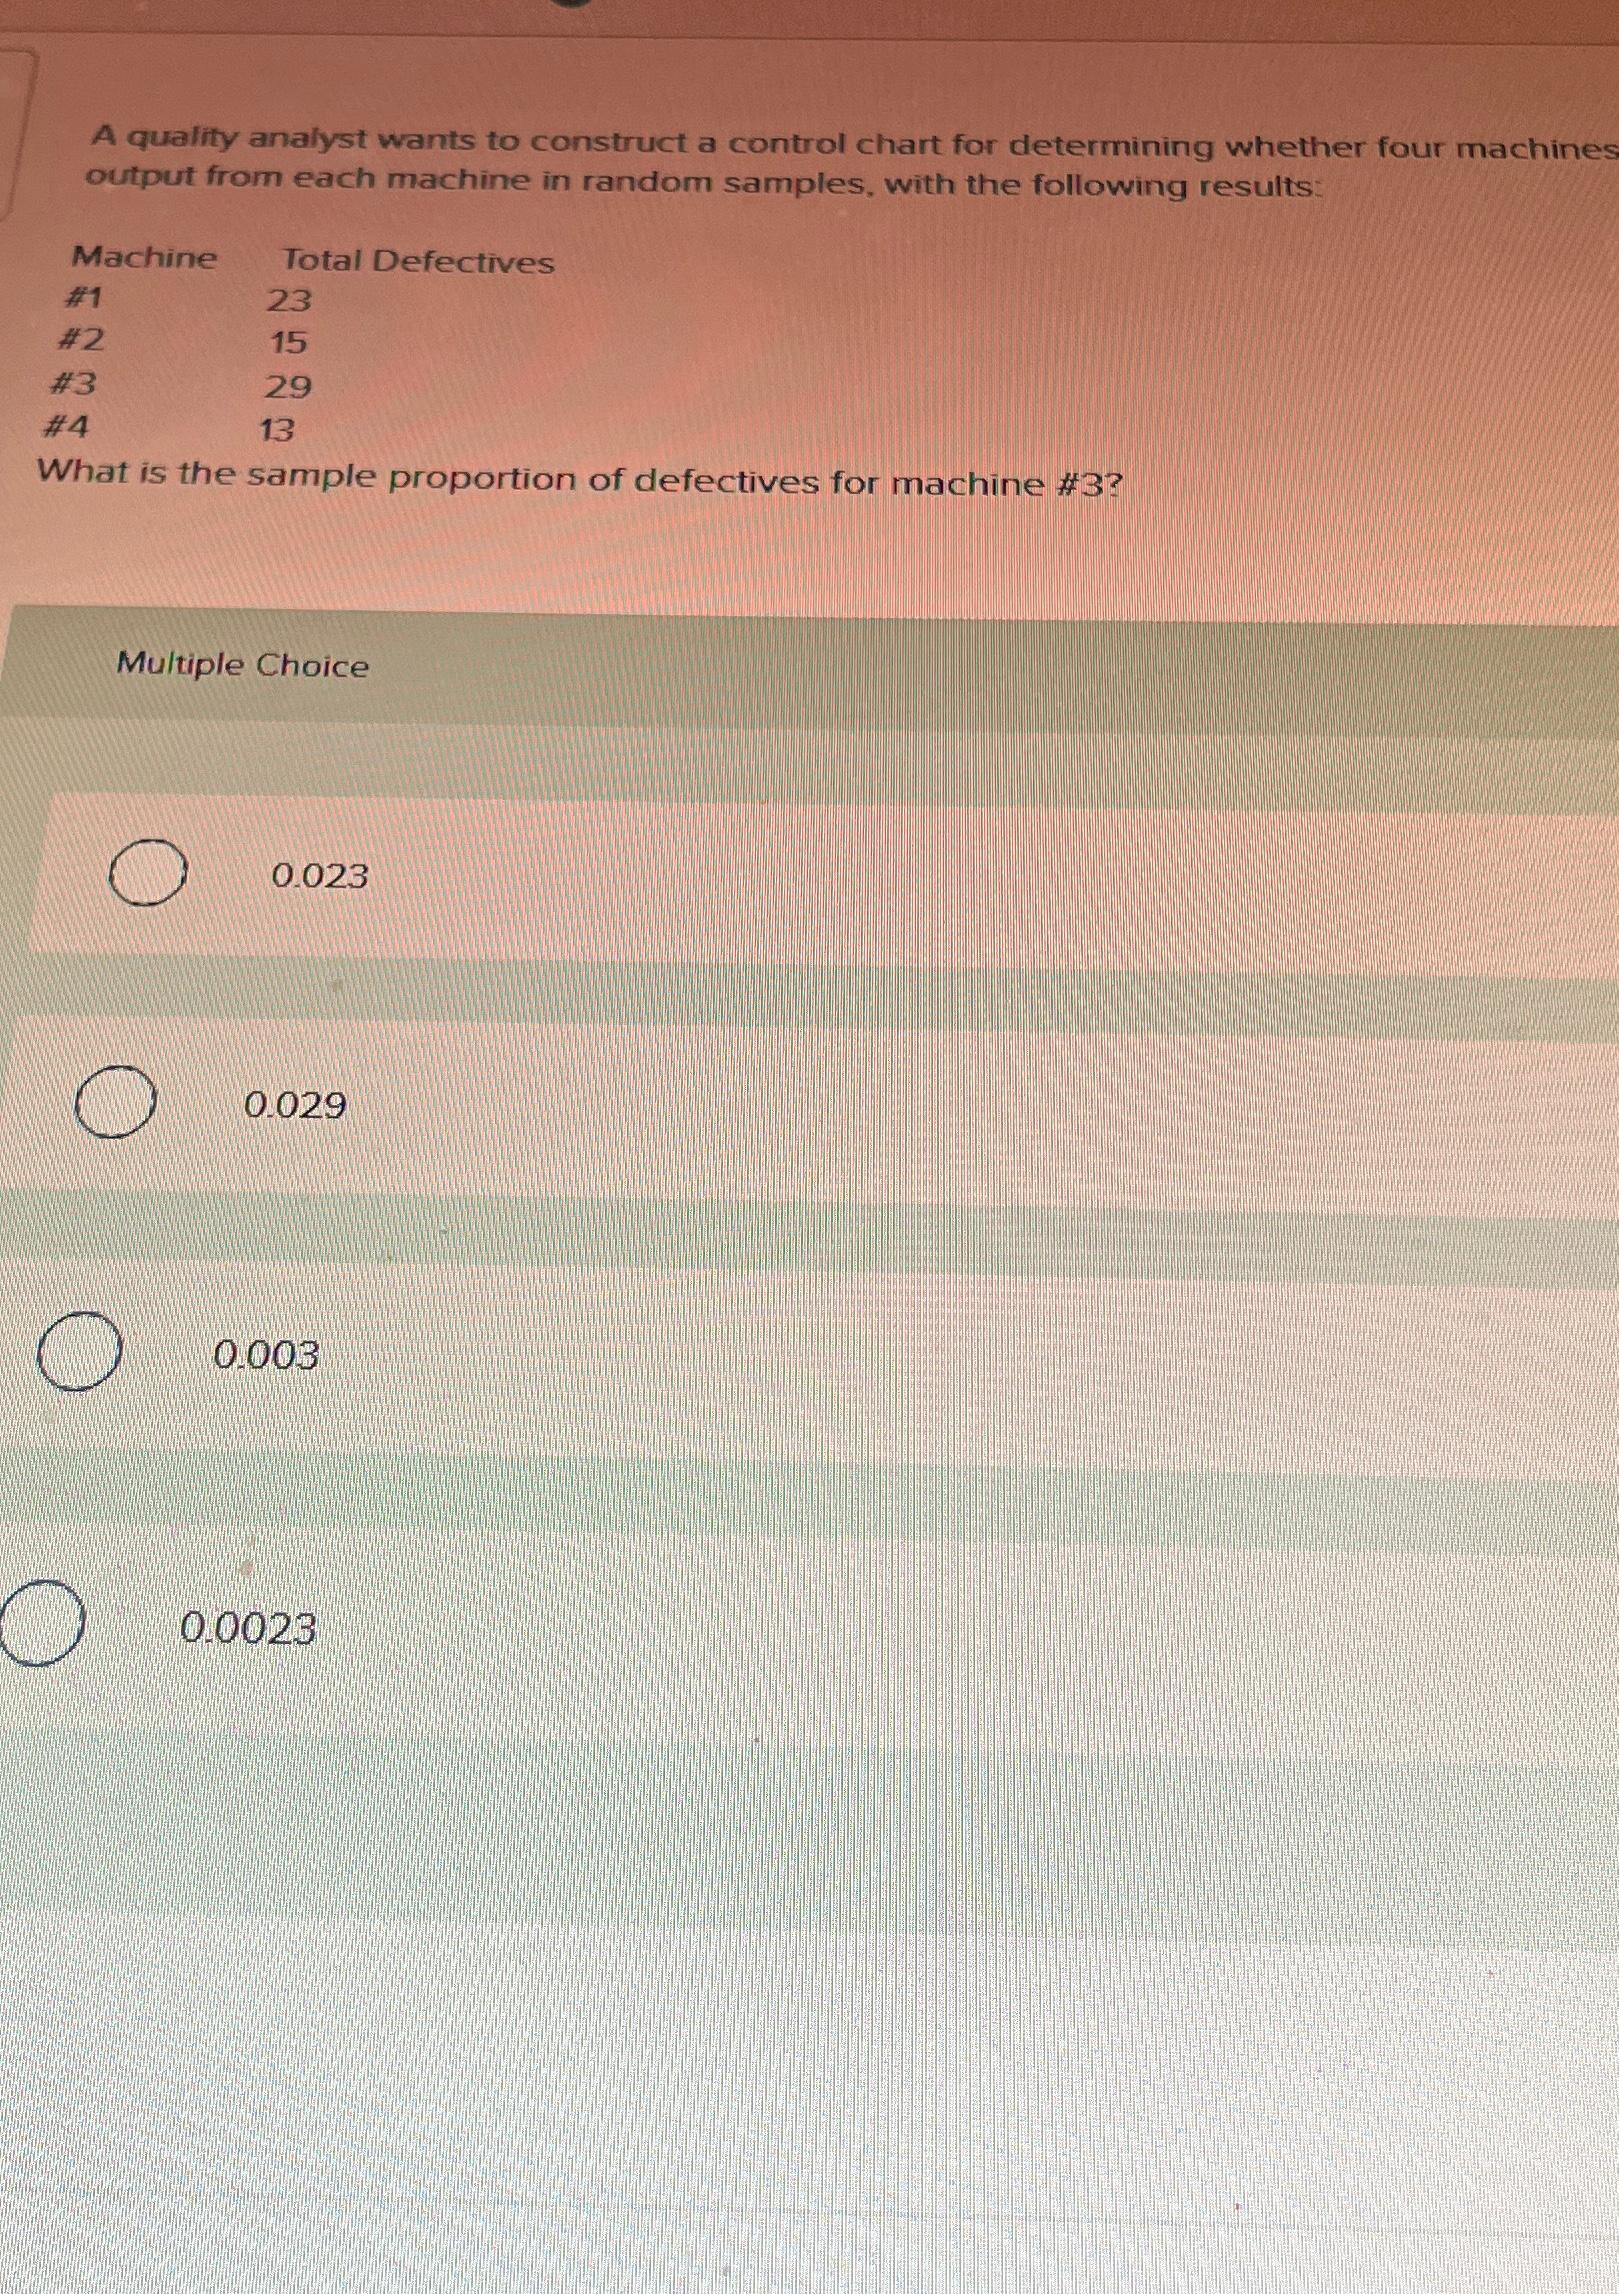
A quality analyst wants to construct a control chart for determining whether four machines output from each machine in random samples, with the following results:
tableMachineTotal Defectives####
What is the sample proportion of defectives for machine #
Multiple Choice
Step by Step Solution
There are 3 Steps involved in it
1 Expert Approved Answer
Step: 1 Unlock

Question Has Been Solved by an Expert!
Get step-by-step solutions from verified subject matter experts
Step: 2 Unlock
Step: 3 Unlock