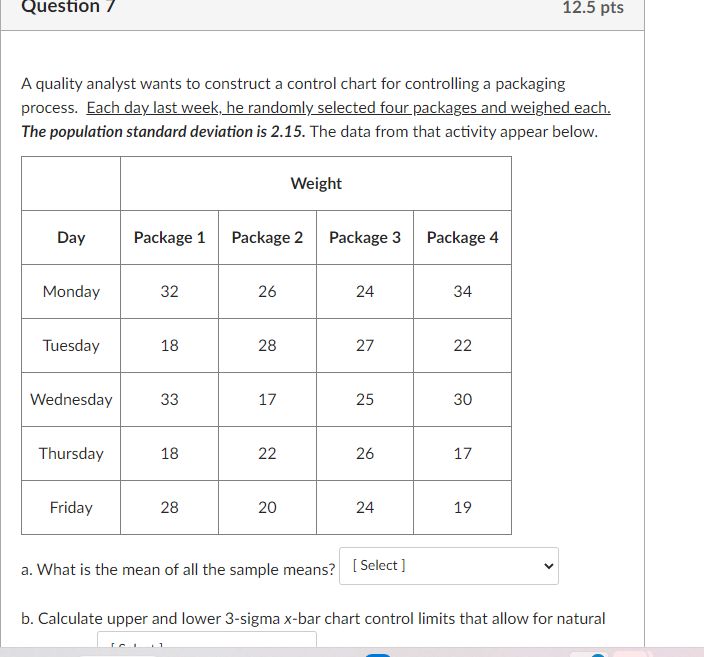
Question: A quality analyst wants to construct a control chart for controlling a packaging process. Each day last week, he randomly selected four packages and weighed

A quality analyst wants to construct a control

A quality analyst wants to construct a control

A quality analyst wants to construct a control chart for controlling a packaging process. Each day last week, he randomly selected four packages and weighed each. The population standard deviation is 2.15. The data from that activity appear below. a. What is the mean of all the sample means? b. Calculate upper and lower 3-sigma x-bar chart control limits that allow for natural b. Calculate upper and lower 3-sigma x-bar chart control limits that allow for natural variations. c. Based on the x-bar chart, is this process in control? d. Calculate upper and lower limits for R-chart. e. Is the range chart in control

Step by Step Solution

There are 3 Steps involved in it

1 Expert Approved Answer
Step: 1 Unlock blur-text-image
Question Has Been Solved by an Expert!

Get step-by-step solutions from verified subject matter experts

Step: 2 Unlock
Step: 3 Unlock

Students Have Also Explored These Related General Management Questions!