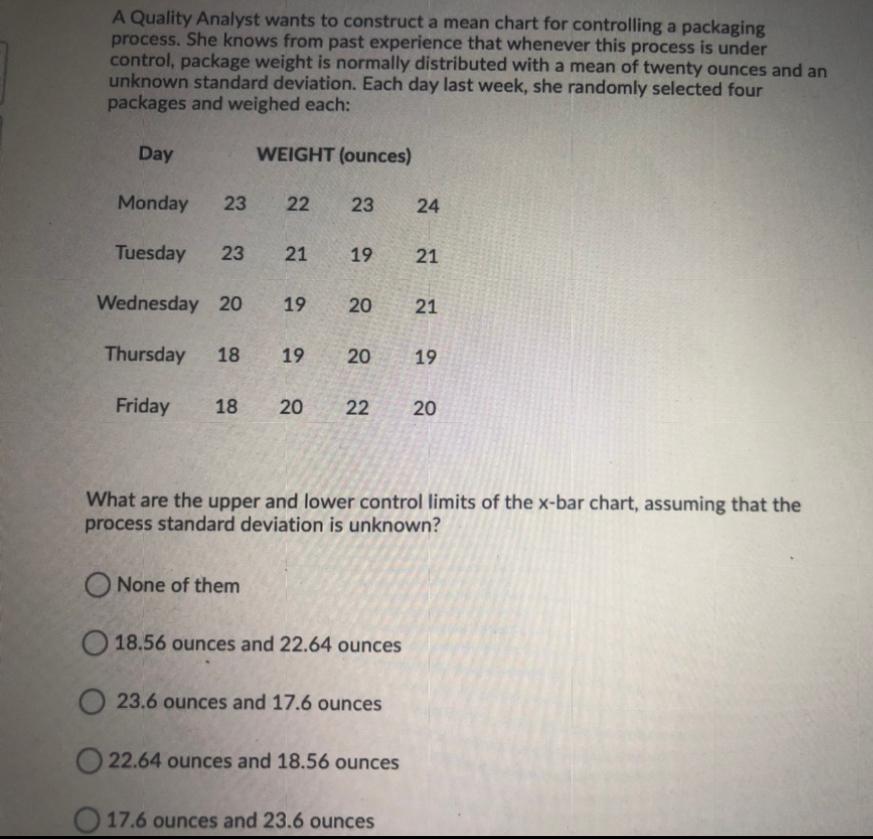
Question: A Quality Analyst wants to construct a mean chart for controlling a packaging process. She knows from past experience that whenever this process is under

A Quality Analyst wants to construct a mean chart

A Quality Analyst wants to construct a mean chart

A Quality Analyst wants to construct a mean chart for controlling a packaging process. She knows from past experience that whenever this process is under control, package weight is normally distributed with a mean of twenty ounces and an unknown standard deviation. Each day last week, she randomly selected four packages and weighed each: Day WEIGHT (ounces) Monday 23 22 23 24 Tuesday 23 21 19 21 Wednesday 20 19 20 21 Thursday 18 19 20 19 Friday 18 20 22 20 What are the upper and lower control limits of the x-bar chart, assuming that the process standard deviation is unknown? None of them O 18.56 ounces and 22.64 ounces O 23.6 ounces and 17.6 ounces 22.64 ounces and 18.56 ounces 17.6 ounces and 23.6 ounces Refer to the data from the previous question. If she computed the upper and lower control limits of the x-bar chart, what does she conclude? Question options: Process is in control Process is out of control due to common cause variation in measurements Process is in control due to randomness in measurements Process is out of control due to assignable cause variation in measurements

Step by Step Solution

There are 3 Steps involved in it

1 Expert Approved Answer
Step: 1 Unlock blur-text-image
Question Has Been Solved by an Expert!

Get step-by-step solutions from verified subject matter experts

Step: 2 Unlock
Step: 3 Unlock

Students Have Also Explored These Related General Management Questions!