

Question: A quality analyst wants to construct a sample mean chart for controlling a packaging process. He knows from past experience that whenever this process is
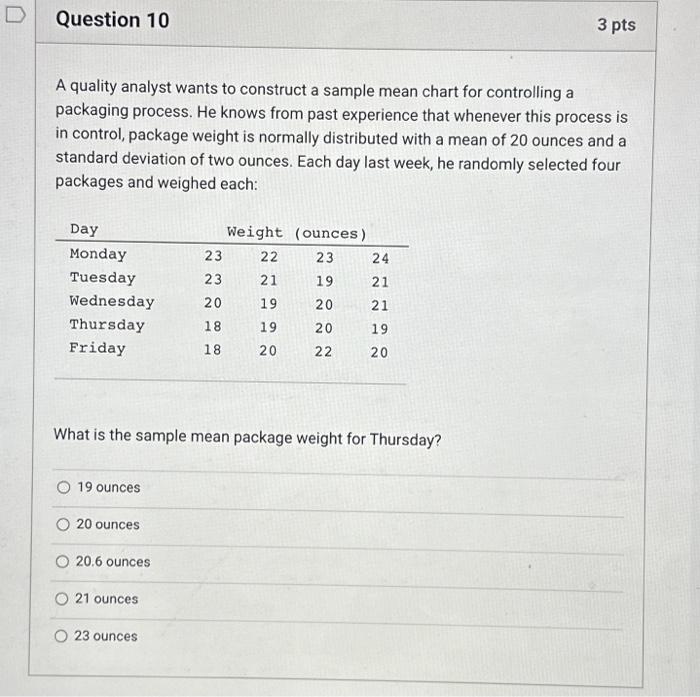
A quality analyst wants to construct a sample mean chart for controlling a packaging process. He knows from past experience that whenever this process is in control, package weight is normally distributed with a mean of 20 ounces and a standard deviation of two ounces. Each day last week, he randomly selected four packages and weighed each: What is the sample mean package weight for Thursday? 19 ounces 20 ounces 20.6 ounces 21 ounces 23 ounces
Step by Step Solution
There are 3 Steps involved in it
1 Expert Approved Answer
Step: 1 Unlock

Question Has Been Solved by an Expert!
Get step-by-step solutions from verified subject matter experts
Step: 2 Unlock
Step: 3 Unlock