

Question: A quality analyst wants to construct a sample mean chart for controlling a packaging process. He knows from past experience that the process standard deviation
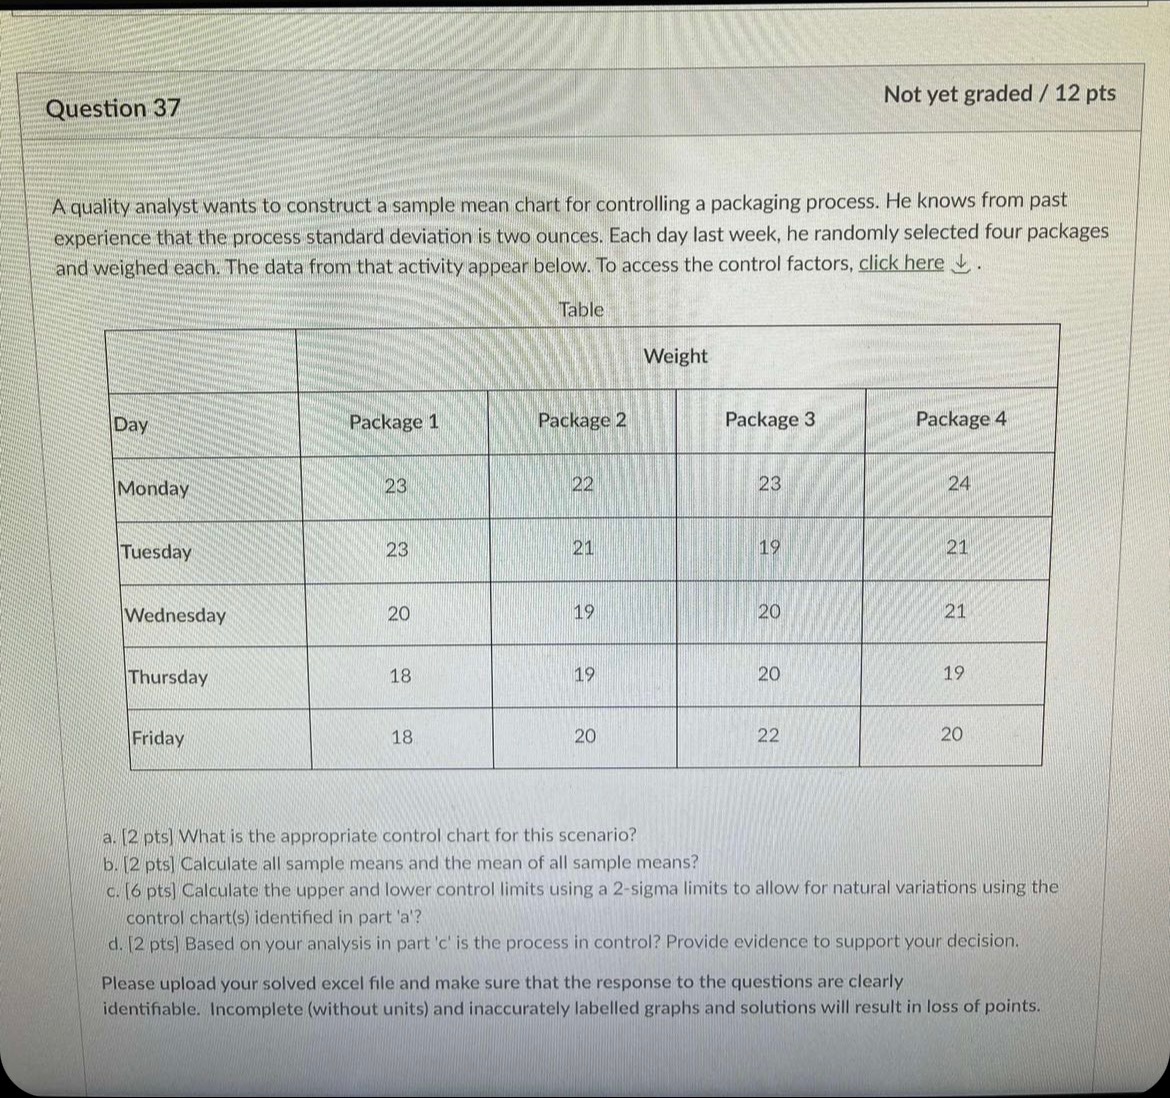
A quality analyst wants to construct a sample mean chart for controlling a packaging process. He knows from past experience that the process standard deviation is two ounces. Each day last week, he randomly selected four packages and weighed each. The data from that activity appear below. To access the control factors, click here . a. [2 pts] What is the appropriate control chart for this scenario? b. [2 pts] Calculate all sample means and the mean of all sample means? c. [6 pts] Calculate the upper and lower control limits using a 2-sigma limits to allow for natural variations using the control chart(s) identified in part 'a'? d. [2 pts] Based on your analysis in part ' c ' is the process in control? Provide evidence to support your decision. Please upload your solved excel file and make sure that the response to the questions are clearly identifiable. Incomplete (without units) and inaccurately labelled graphs and solutions will result in loss of points
Step by Step Solution
There are 3 Steps involved in it

Get step-by-step solutions from verified subject matter experts