

Question: A quality analyst wants to construct a sample mean chart for controlling a packaging process. He knows from experience that package weight is norma distributed
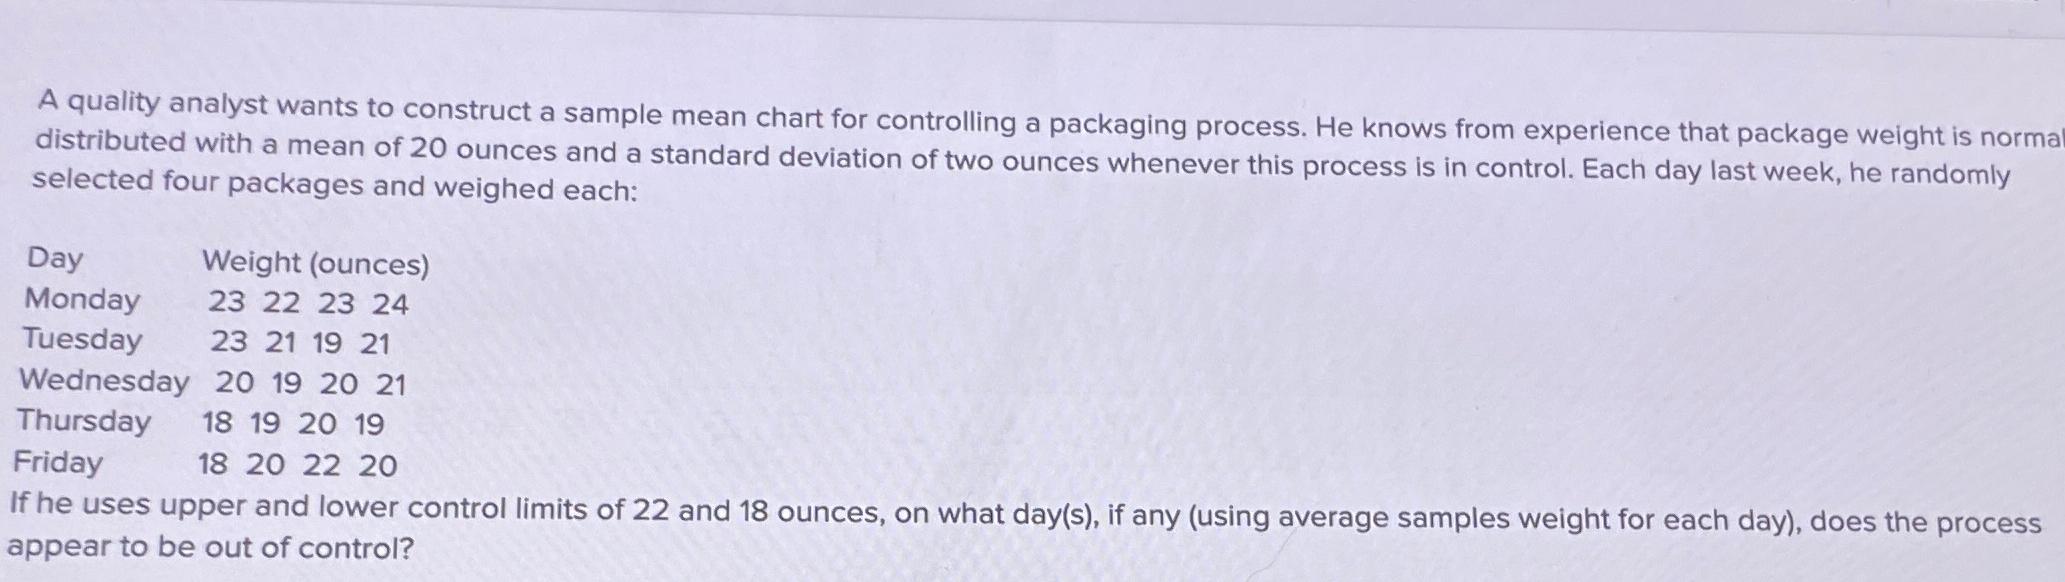
A quality analyst wants to construct a sample mean chart for controlling a packaging process. He knows from experience that package weight is norma distributed with a mean of ounces and a standard deviation of two ounces whenever this process is in control. Each day last week, he randomly selected four packages and weighed each:
tableDayWeight ouncesMondayTuesdayWednesdayThursdayFriday
If he uses upper and lower control limits of and ounces, on what days if any using average samples weight for each day does the process appear to be out of control?
Step by Step Solution
There are 3 Steps involved in it
1 Expert Approved Answer
Step: 1 Unlock

Question Has Been Solved by an Expert!
Get step-by-step solutions from verified subject matter experts
Step: 2 Unlock
Step: 3 Unlock