

Question: A quality engineer collected process data for five subgroups with each subgroup consisting of two samples (n=2). The median and ranges of samples in
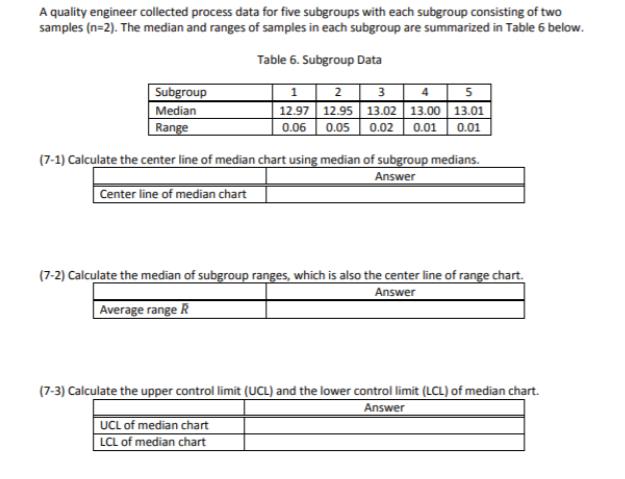
A quality engineer collected process data for five subgroups with each subgroup consisting of two samples (n=2). The median and ranges of samples in each subgroup are summarized in Table 6 below. Table 6. Subgroup Data Subgroup Median Range 1 2 3 4 5 12.97 12.95 13.02 13.00 13.01 0.06 0.05 0.02 0.01 0.01 (7-1) Calculate the center line of median chart using median of subgroup medians. Center line of median chart Answer (7-2) Calculate the median of subgroup ranges, which is also the center line of range chart. Average range R Answer (7-3) Calculate the upper control limit (UCL) and the lower control limit (LCL) of median chart. UCL of median chart LCL of median chart Answer
Step by Step Solution
There are 3 Steps involved in it
71 To calculate the center line of the median chart we find the median of the subgroup medians Medi... View full answer

Get step-by-step solutions from verified subject matter experts