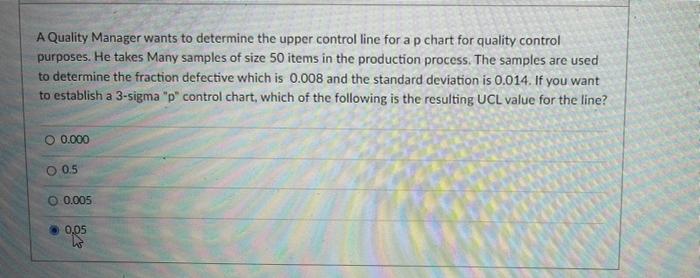
Question: A Quality Manager wants to determine the upper control line for a p chart for quality control purposes. He takes Many samples of size 50

A Quality Manager wants to determine the upper
A Quality Manager wants to determine the upper control line for a p chart for quality control purposes. He takes Many samples of size 50 items in the production process. The samples are used to determine the fraction defective which is 0.008 and the standard deviation is 0.014. If you want to establish a 3-sigma "p" control chart, which of the following is the resulting UCL value for the line? O 0.000 O 0.5 0.005 0,05 Question 52 5 pts The Quality Operations Manager has found out that there are 9 total defects from 20 samples, each Samole consisting of 31 Individual items in a production process, what is the fraction defective for value for p that could be used in ap chart for quality control purposes? Use the total detects and total number of observations to calculate your answer in at least 3 decimal places Question 53 2 pts You want to develop a three-sigma R chart. You know the average range is 5 based on 5 samples of size 8. Wisch of the following is the resulting UCL? Use the value of De from the constants for calculating control limits.)

Step by Step Solution

There are 3 Steps involved in it

1 Expert Approved Answer
Step: 1 Unlock blur-text-image
Question Has Been Solved by an Expert!

Get step-by-step solutions from verified subject matter experts

Step: 2 Unlock
Step: 3 Unlock

Students Have Also Explored These Related General Management Questions!