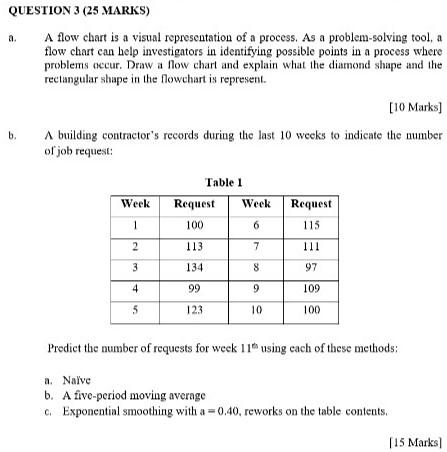
Question: a. QUESTION 3 (25 MARKS) A flow chart is a visual representation of a process. As a problem-solving tool, a flow chart can help investigators

a. QUESTION 3 (25 MARKS) A flow chart is a visual

a. QUESTION 3 (25 MARKS) A flow chart is a visual representation of a process. As a problem-solving tool, a flow chart can help investigators in identifying possible points in a process where problems occur. Draw a flow chart and explain what the diamond shape and the rectangular shape in the flowchart is represent. [10 Marks] A building contractor's records during the last 10 weeks to indicate the number of job request: b. Week 1 Table 1 Request Week 100 6 Request 115 2 113 7 111 3 134 8 8 97 4 99 9 9 109 5 123 10 100 Predict the number of requests for week 11 using each of these methods: a. Nalve b. A five-period moving average 6 Exponential smoothing with a =0,40, reworks on the table contents. [15 Marks

Step by Step Solution

There are 3 Steps involved in it

1 Expert Approved Answer
Step: 1 Unlock blur-text-image
Question Has Been Solved by an Expert!

Get step-by-step solutions from verified subject matter experts

Step: 2 Unlock
Step: 3 Unlock

Students Have Also Explored These Related General Management Questions!