

Question: A random sample of 1000 students was interviewed about their high school SAT scores (X ) and their current university GPAs (Y). The students were

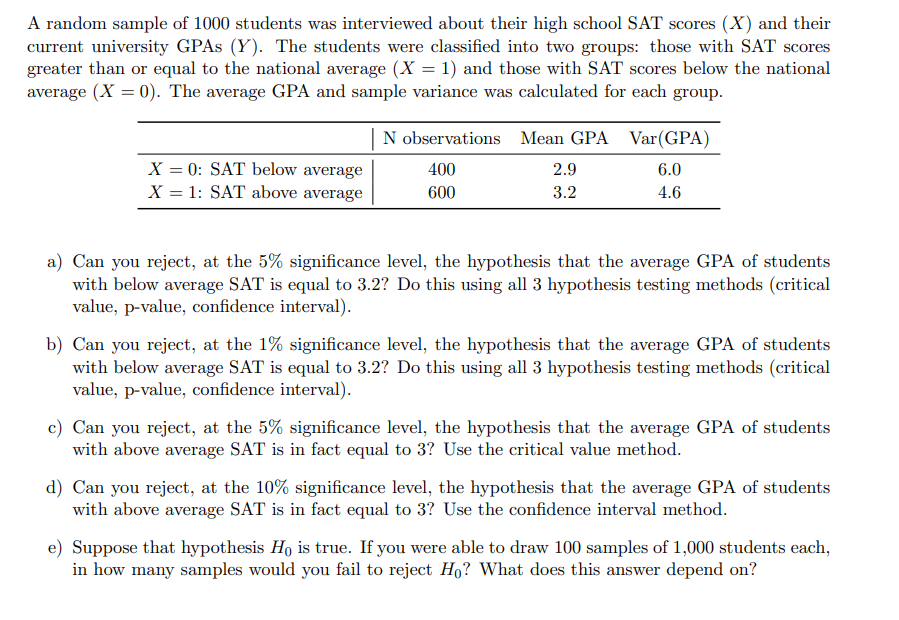
A random sample of 1000 students was interviewed about their high school SAT scores (X ) and their current university GPAs (Y). The students were classified into two groups: those with SAT scores greater than or equal to the national average (X = 1) and those with SAT scores below the national average (X = 0). The average GPA and sample variance was calculated for each group. N observations Mean GPA Var(GPA) X =0: SAT below average 400 2.9 6.0 X = 1: SAT above average 600 3.2 4.6 a) Can you reject, at the 5% significance level, the hypothesis that the average GPA of students with below average SAT is equal to 3.2? Do this using all 3 hypothesis testing methods (critical value, p-value, confidence interval). b) Can you reject, at the 1% significance level, the hypothesis that the average GPA of students with below average SAT is equal to 3.2? Do this using all 3 hypothesis testing methods (critical value, p-value, confidence interval). c) Can you reject, at the 5% significance level, the hypothesis that the average GPA of students with above average SAT is in fact equal to 3? Use the critical value method. d) Can you reject, at the 10% significance level, the hypothesis that the average GPA of students with above average SAT is in fact equal to 3? Use the confidence interval method. e) Suppose that hypothesis Ho is true. If you were able to draw 100 samples of 1,000 students each, in how many samples would you fail to reject Ho? What does this answer depend on
Step by Step Solution
There are 3 Steps involved in it

Get step-by-step solutions from verified subject matter experts