

Question: A random sample of fifth-grade students and a random sample of eighth-grade students were tested to see how many states in the United States they

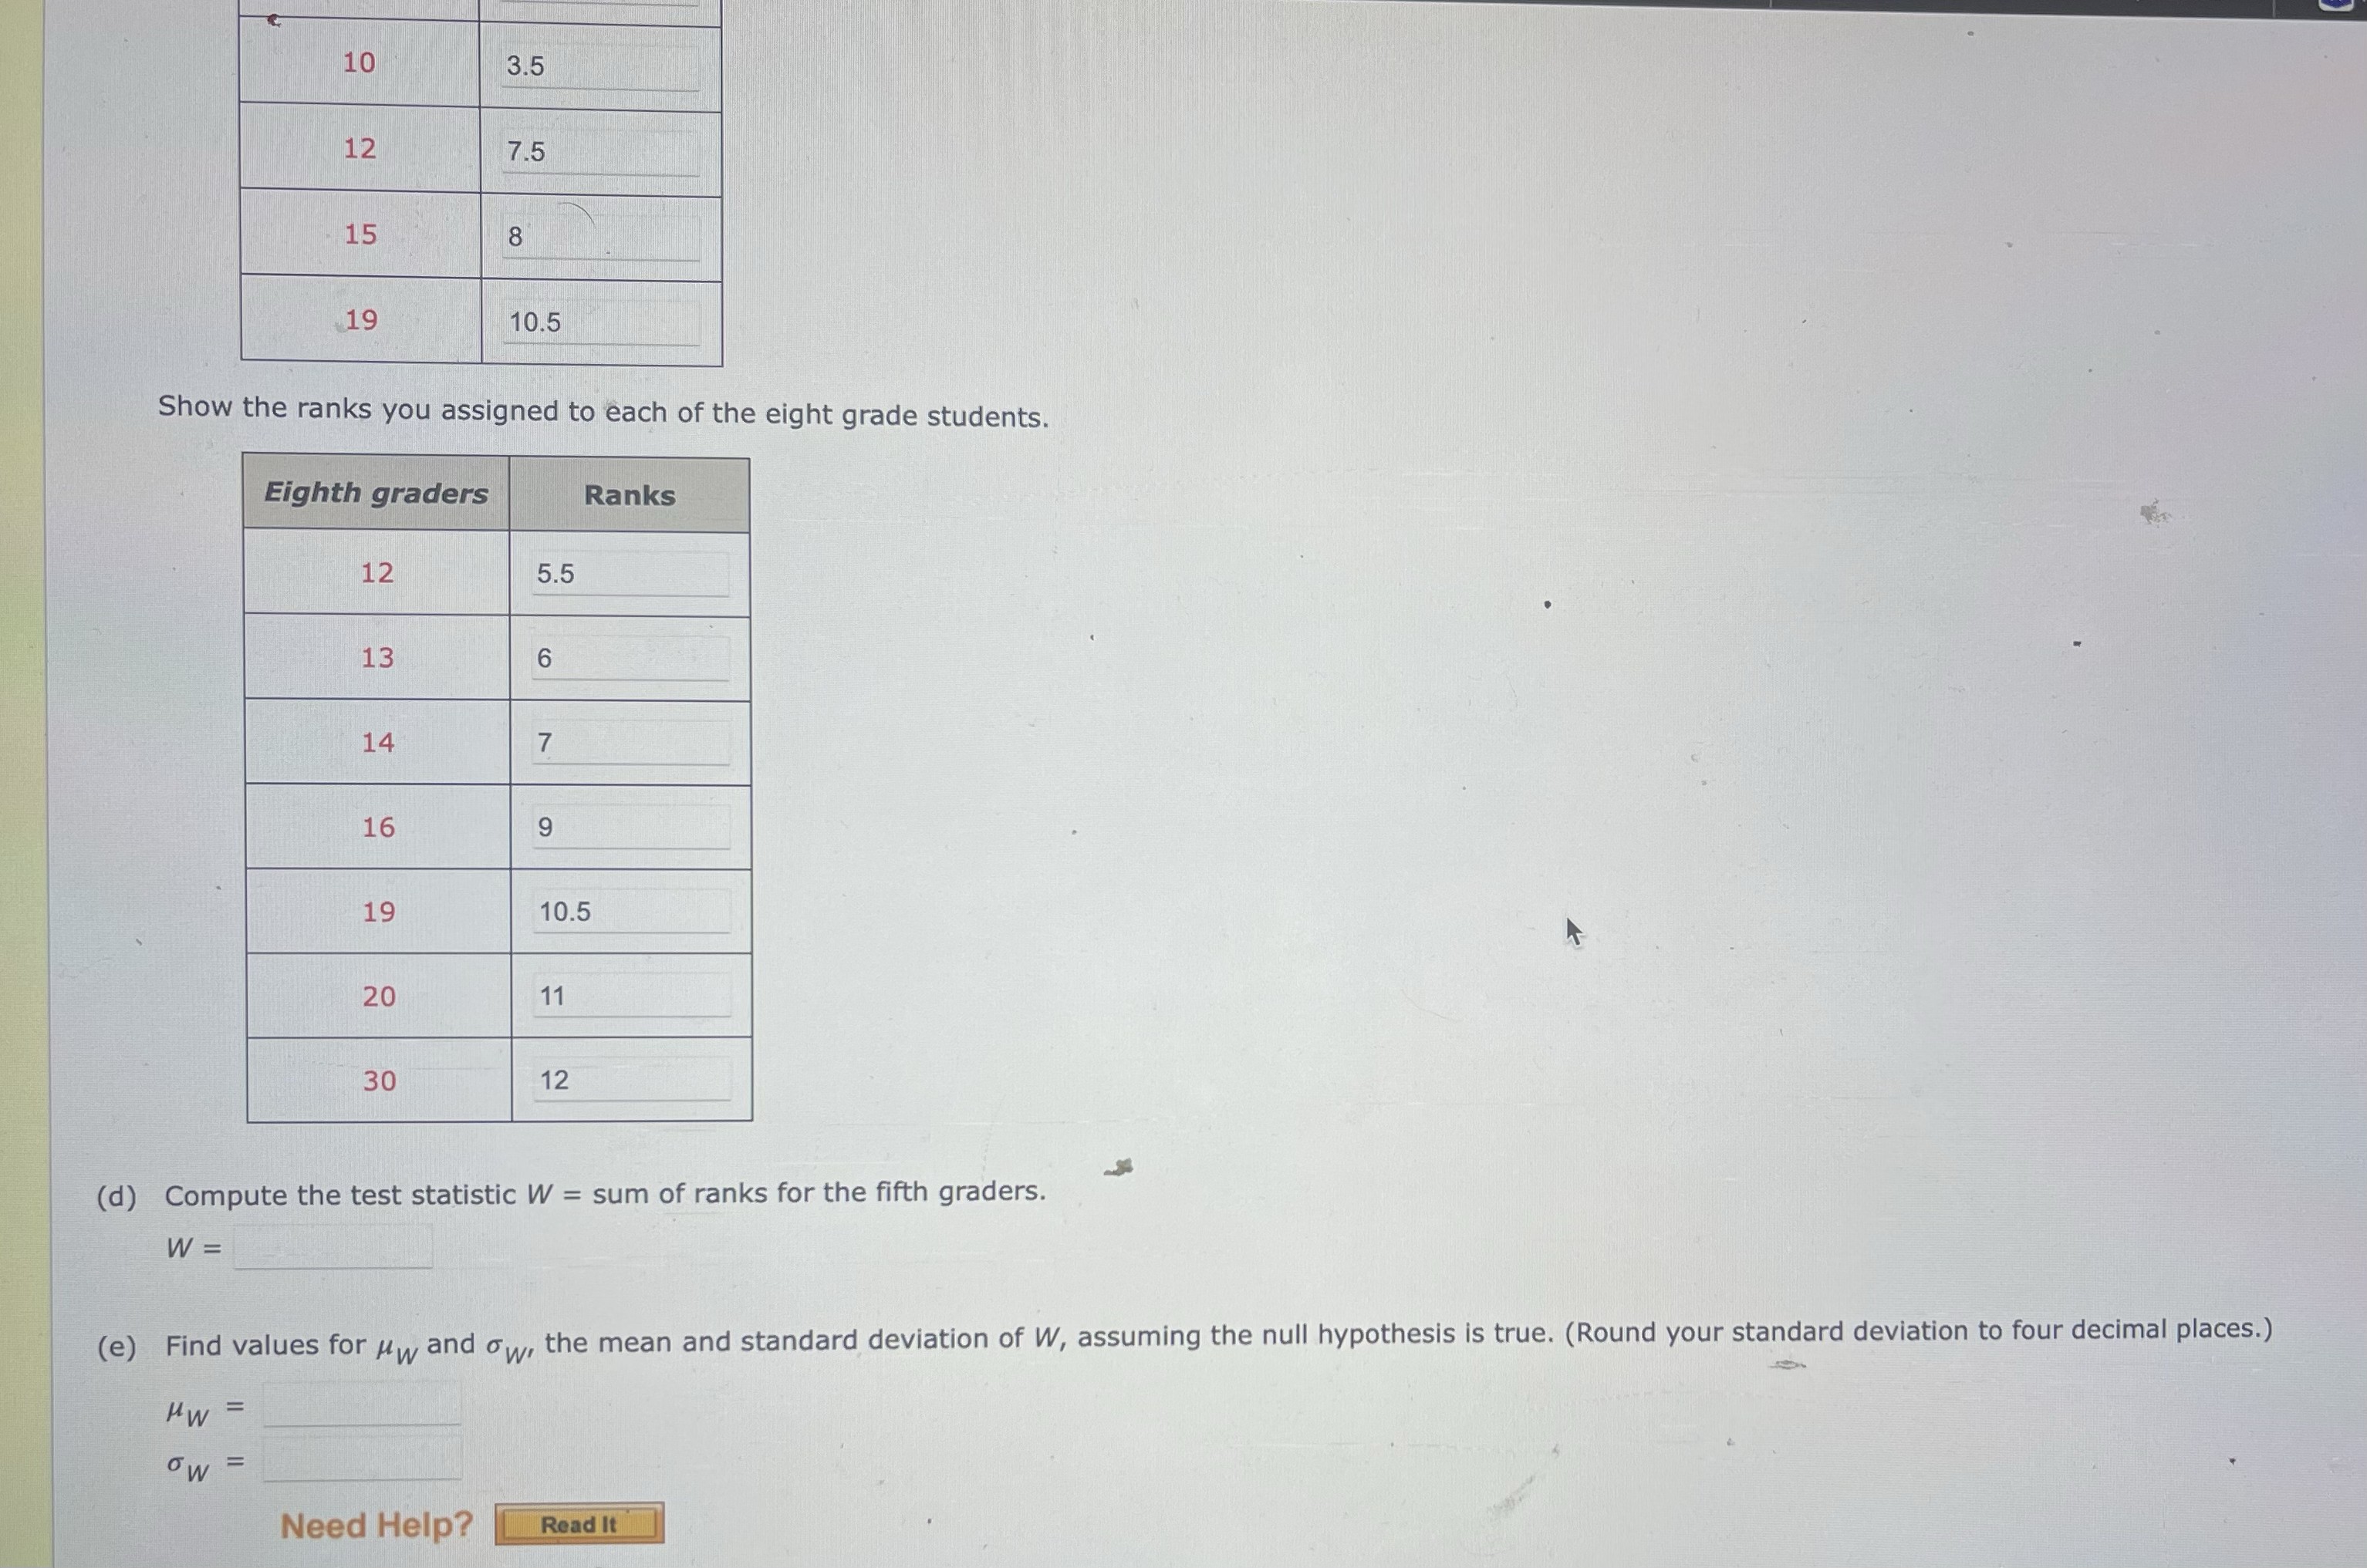
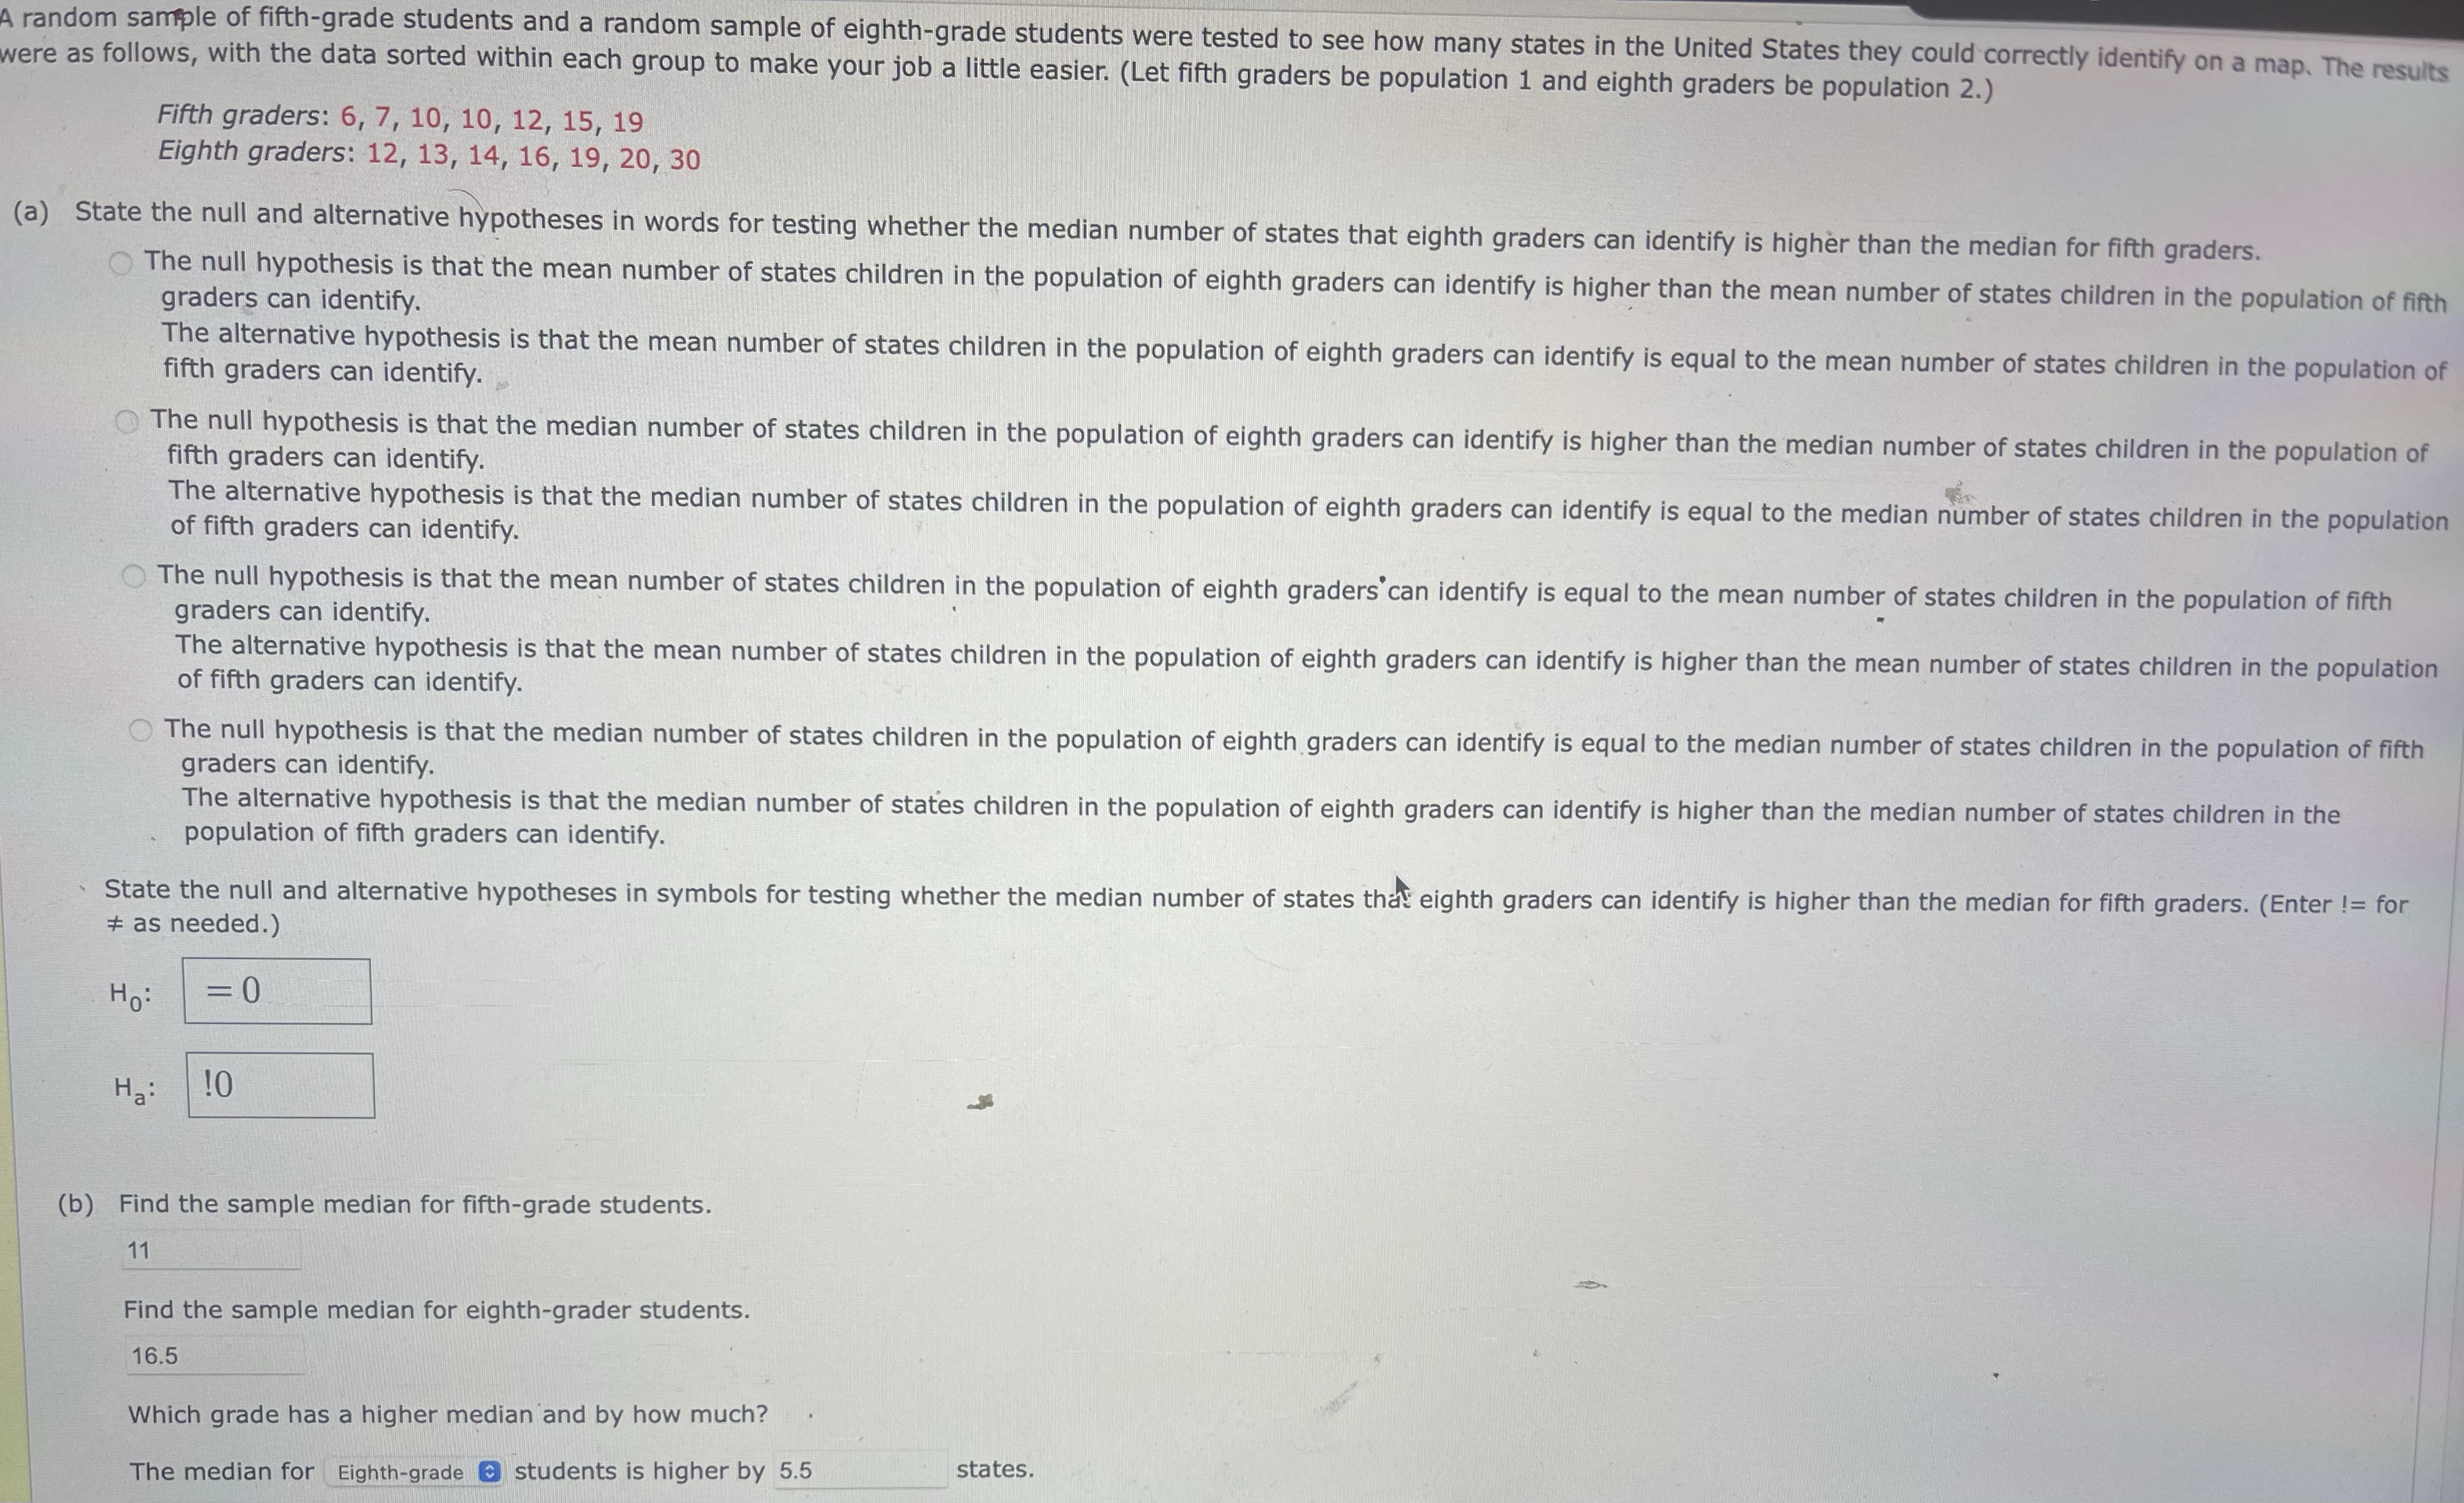

A random sample of fifth-grade students and a random sample of eighth-grade students were tested to see how many states in the United States they could correctly identify on a map. The results were as follows, with the data sorted within each group to make your job a little easier. (Let fifth graders be population 1 and eighth graders be population 2.) Fifth graders: 6, 7, 10, 10, 12, 15, 19 Eighth graders: 12, 13, 14, 16, 19, 20, 30 (a) State the null and alternative hypotheses in words for testing whether the median number of states that eighth graders can identify is higher than the median for fifth graders. The null hypothesis is that the mean number of states children in the population of eighth graders can identify is higher than the mean number of states children in the population of fifth graders can identify. The alternative hypothesis is that the mean number of states children in the population of eighth graders can identify is equal to the mean number of states children in the population of fifth graders can identify. The null hypothesis is that the median number of states children in the population of eighth graders can identify is higher than the median number of states children in the population of fifth graders can identify. The alternative hypothesis is that the median number of states children in the population of eighth graders can identify is equal to the median number of states children in the population of fifth graders can identify. The null hypothesis is that the mean number of states children in the population of eighth graders can identify is equal to the mean number of states children in the population of fifth graders can identify. The alternative hypothesis is that the mean number of states children in the population of eighth graders can identify is higher than the mean number of states children in the population of fifth graders can identify. The null hypothesis is that the median number of states children in the population of eighth graders can identify is equal to the median number of states children in the population of fifth graders can identify. The alternative hypothesis is that the median number of states children in the population of eighth graders can identify is higher than the median number of states children in the population of fifth graders can identify. State the null and alternative hypotheses in symbols for testing whether the median number of states that eighth graders can identify is higher than the median for fifth graders. (Enter != for # as needed.) H: = 0 Ha: 10 (b) Find the sample median for fifth-grade students. 11 Find the sample median for eighth-grader students. 16.5 Which grade has a higher median and by how much? The median for Eighth-grade @ students is higher by 5.5 states.10 3.5 12 7.5 15 8 19 10.5 Show the ranks you assigned to each of the eight grade students. Eighth graders Ranks 12 5.5 13 6 14 7 16 9 19 10.5 20 11 30 12 (d) Compute the test statistic W = sum of ranks for the fifth graders. W = (e) Find values for My and ow, the mean and standard deviation of W, assuming the null hypothesis is true. (Round your standard deviation to four decimal places.) HW = ow = Need Help? Read It
Step by Step Solution
There are 3 Steps involved in it

Get step-by-step solutions from verified subject matter experts