

Question: A random variable is normally distributed with mean of u = 60 and a standard deviation of o = 5. (a) The following figure shows
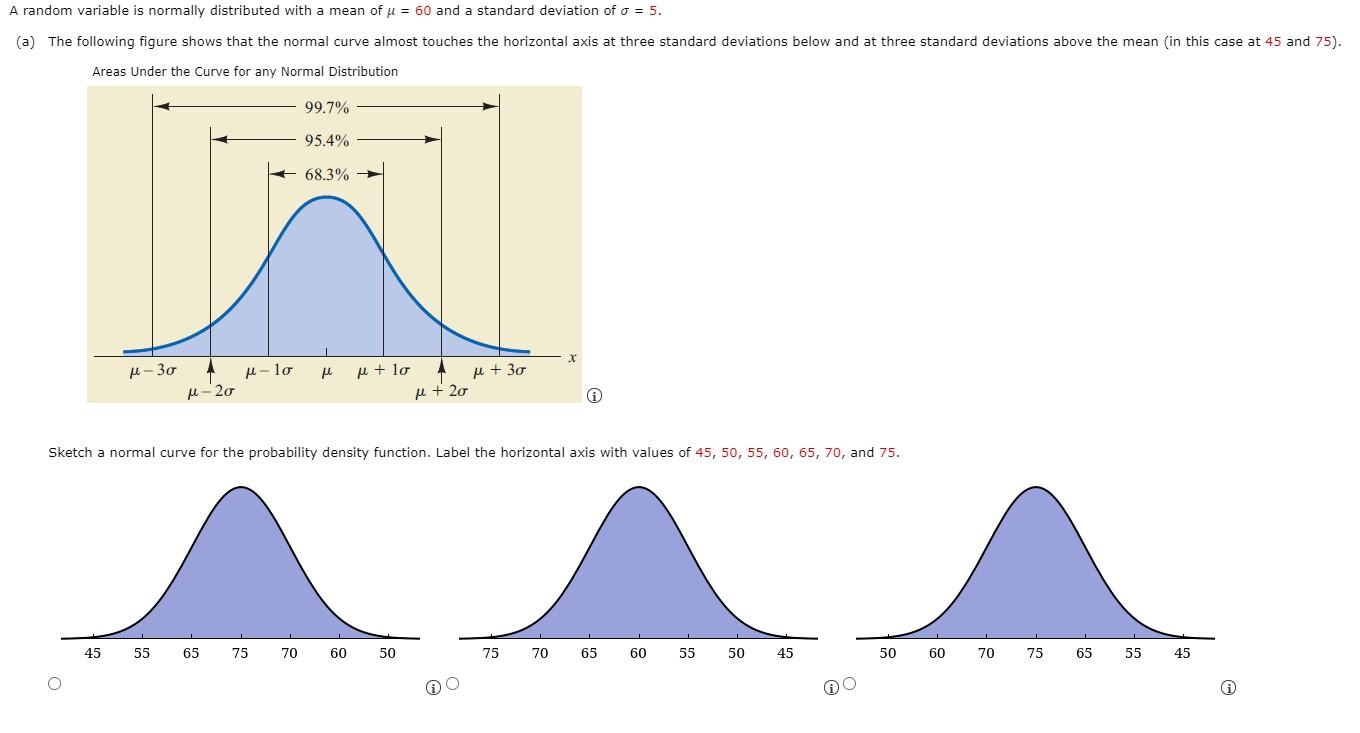
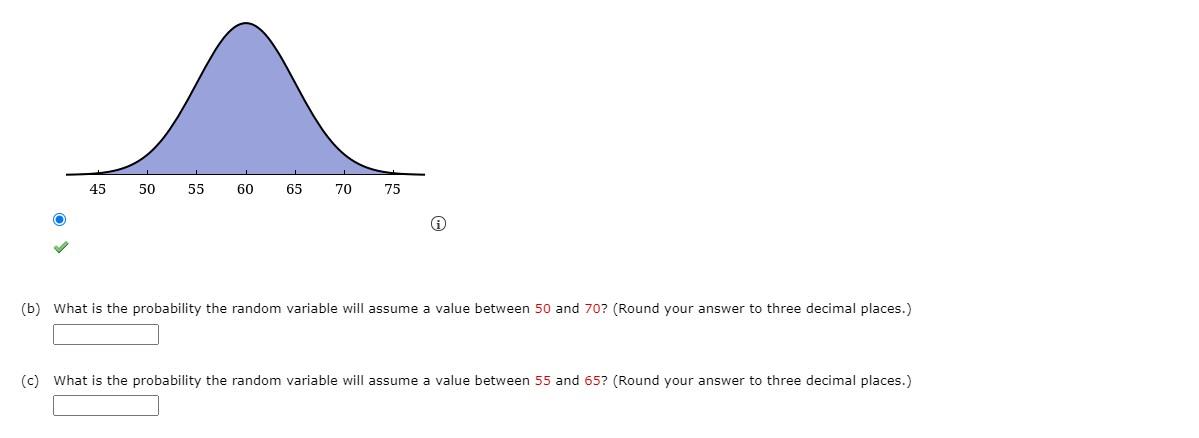
A random variable is normally distributed with mean of u = 60 and a standard deviation of o = 5. (a) The following figure shows that the normal curve almost touches the horizontal axis at three standard deviations below and at three standard deviations above the mean (in this case at 45 and 75). Areas Under the Curve for any Normal Distribution 99.7% 95.4% * 68.3% M-30 u u-lo u-20 u + lo u + 30 M + 20 Sketch a normal curve for the probability density function. Label the horizontal axis with values of 45, 50, 55, 60, 65, 70, and 75. 45 55 65 75 70 60 50 75 70 65 60 55 50 45 50 60 70 75 65 55 45 o i 45 50 55 60 65 70 75 (b) What is the probability the random variable will assume a value between 50 and 70? (Round your answer to three decimal places.) (c) What is the probability the random variable will assume a value between 55 and 65? (Round your answer to three decimal places.)
Step by Step Solution
There are 3 Steps involved in it

Get step-by-step solutions from verified subject matter experts