

Question: A randomized control experiment to test the utility of a health drink was conducted between two groups of individuals of the same age, height, and
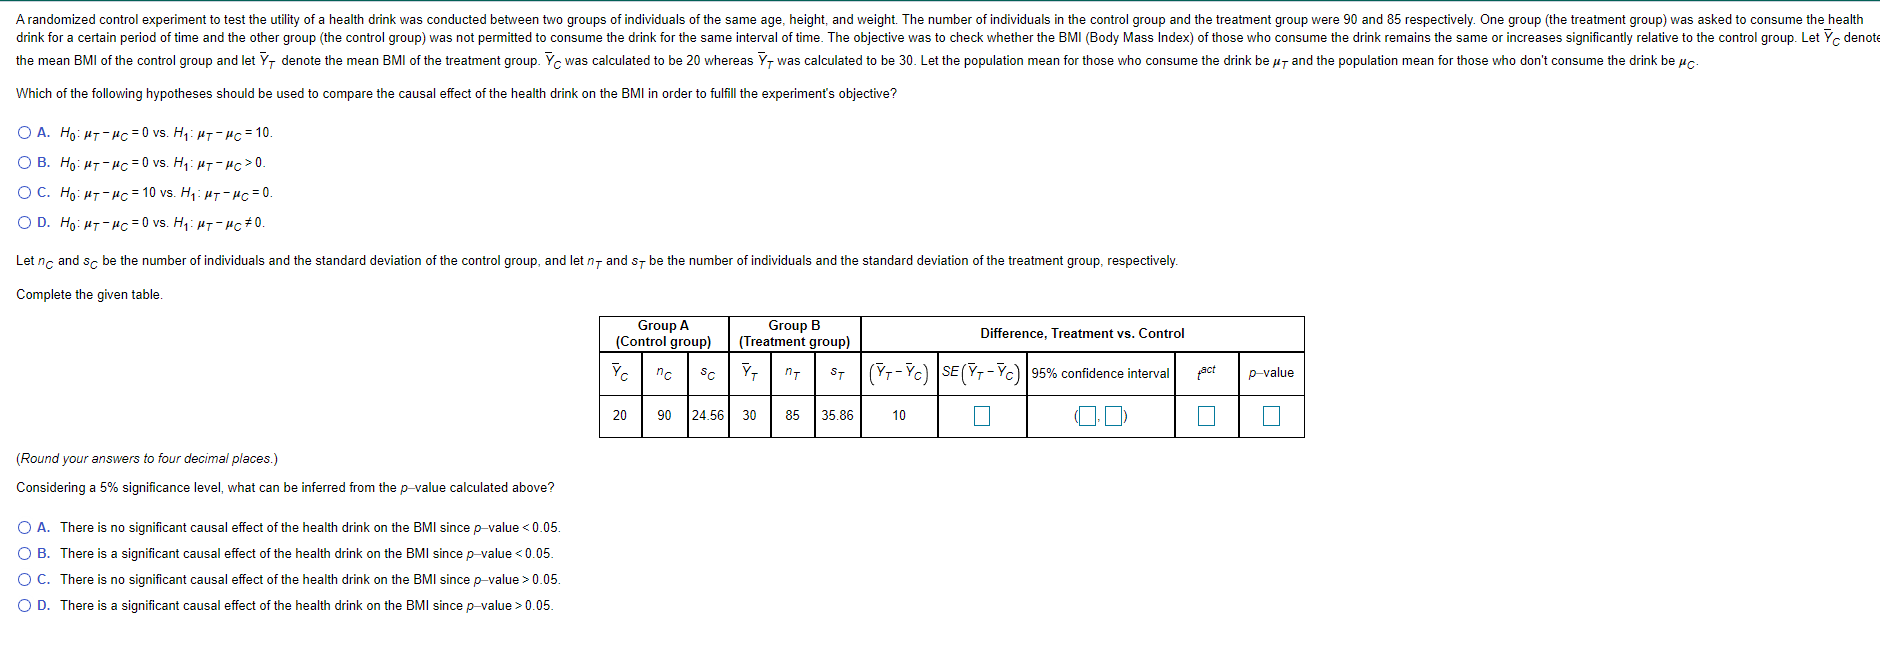
A randomized control experiment to test the utility of a health drink was conducted between two groups of individuals of the same age, height, and weight. The number of individuals in the control group and the treatment group were 90 and 85 respectively. One group (the treatment group) was asked to consume the health drink for a certain period of time and the other group (the control group) was not permitted to consume the drink for the same interval of time. The objective was to check whether the BMI (Body Mass Index) of those who consume the drink remains the same or increases significantly relative to the control group. Let Yc denote the mean BMI of the control group and let y, denote the mean BMI of the treatment group. Tc was calculated to be 20 whereas 7 was calculated to be 30. Let the population mean for those who consume the drink be ut and the population mean for those who don't consume the drink be uc Which of the following hypotheses should be used to compare the causal effect of the health drink on the BMI in order to fulfill the experiment's objective? O A. Hout- uc = 0 vs. Hyut-Mc = 10. OB. Ho: HT-uc = 0 vs. Hy: HT-uc>0 OC. Ho: HT-Mc = 10 vs. Hy: HT-MC = 0. OD. Hout-uc = 0 vs. Hy: HT-MC+0. Let nc and sc be the number of individuals and the standard deviation of the control group, and let it and sy be the number of individuals and the standard deviation of the treatment group, respectively. Complete the given table. Group A (Control group) Group B (Treatment group) Difference, Treatment vs. Control Yo nc Sc Y nt ST (-C) SE(7-7) 95% confidence interval act p-value 20 90 24.56 30 85 35.86 10 (Round your answers to four decimal places.) Considering a 5% significance level, what can be inferred from the p-value calculated above? O A. There is no significant causal effect of the health drink on the BMI since p-value 0.05. OD. There is a significant causal effect of the health drink on the BMI since p-value > 0.05. A randomized control experiment to test the utility of a health drink was conducted between two groups of individuals of the same age, height, and weight. The number of individuals in the control group and the treatment group were 90 and 85 respectively. One group (the treatment group) was asked to consume the health drink for a certain period of time and the other group (the control group) was not permitted to consume the drink for the same interval of time. The objective was to check whether the BMI (Body Mass Index) of those who consume the drink remains the same or increases significantly relative to the control group. Let Yc denote the mean BMI of the control group and let y, denote the mean BMI of the treatment group. Tc was calculated to be 20 whereas 7 was calculated to be 30. Let the population mean for those who consume the drink be ut and the population mean for those who don't consume the drink be uc Which of the following hypotheses should be used to compare the causal effect of the health drink on the BMI in order to fulfill the experiment's objective? O A. Hout- uc = 0 vs. Hyut-Mc = 10. OB. Ho: HT-uc = 0 vs. Hy: HT-uc>0 OC. Ho: HT-Mc = 10 vs. Hy: HT-MC = 0. OD. Hout-uc = 0 vs. Hy: HT-MC+0. Let nc and sc be the number of individuals and the standard deviation of the control group, and let it and sy be the number of individuals and the standard deviation of the treatment group, respectively. Complete the given table. Group A (Control group) Group B (Treatment group) Difference, Treatment vs. Control Yo nc Sc Y nt ST (-C) SE(7-7) 95% confidence interval act p-value 20 90 24.56 30 85 35.86 10 (Round your answers to four decimal places.) Considering a 5% significance level, what can be inferred from the p-value calculated above? O A. There is no significant causal effect of the health drink on the BMI since p-value 0.05. OD. There is a significant causal effect of the health drink on the BMI since p-value > 0.05
Step by Step Solution
There are 3 Steps involved in it

Get step-by-step solutions from verified subject matter experts