

Question: A real number between 2 and 9 will be picked according to the probability distribution shown in the figure. Regions under the curve are labeled
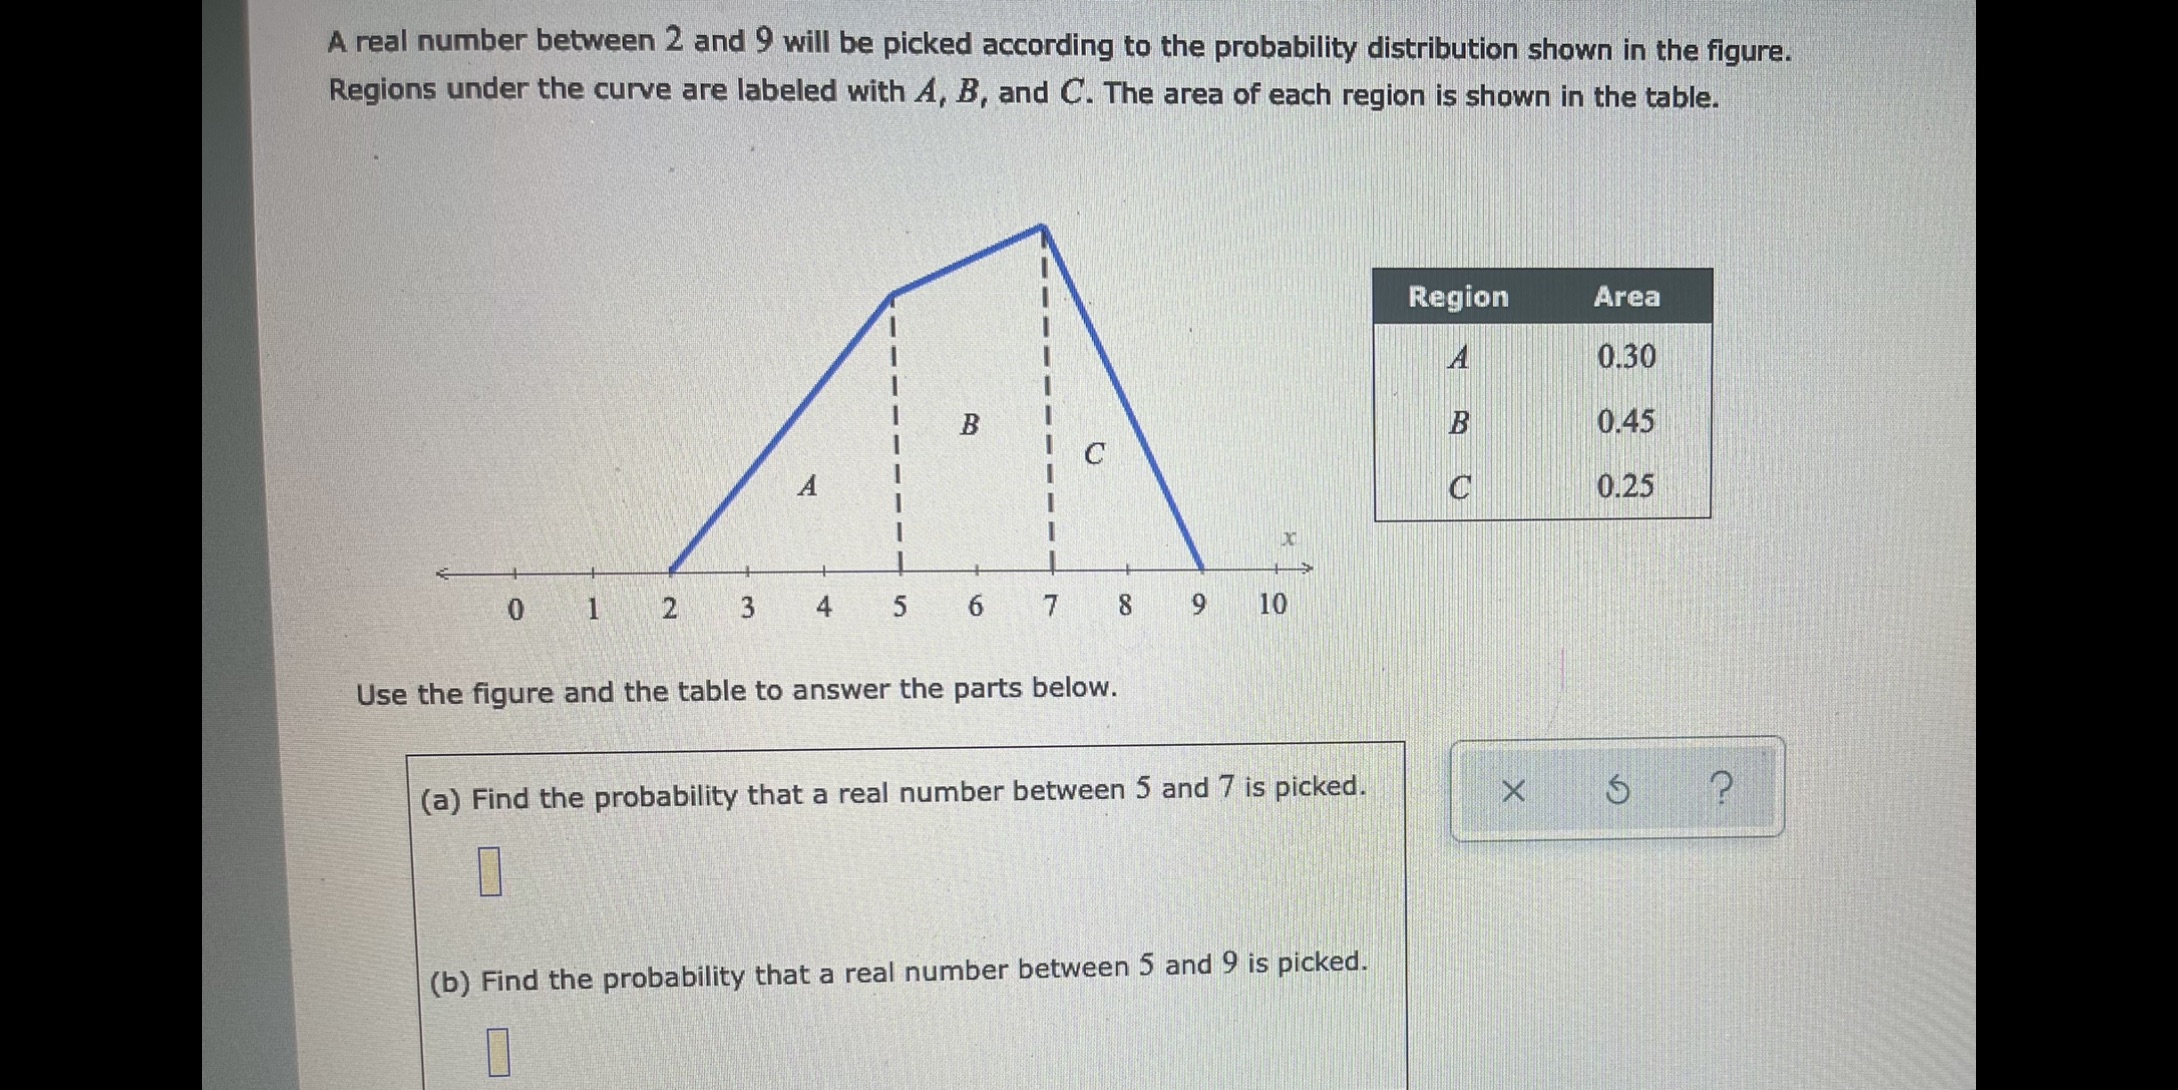
A real number between 2 and 9 will be picked according to the probability distribution shown in the figure. Regions under the curve are labeled with A, B, and C. The area of each region is shown in the table. Region Area A 0.30 B B 0.45 A 0.25 0 2 3 4 5 6 7 8 10 Use the figure and the table to answer the parts below. (a) Find the probability that a real number between 5 and 7 is picked. X 5 ? (b) Find the probability that a real number between 5 and 9 is picked
Step by Step Solution
There are 3 Steps involved in it
1 Expert Approved Answer
Step: 1 Unlock

Question Has Been Solved by an Expert!
Get step-by-step solutions from verified subject matter experts
Step: 2 Unlock
Step: 3 Unlock