

Question: A realtor collected the following data for a random sample of ten homes that recently sold in her area. 1) (2 points) Using a scatterplot,
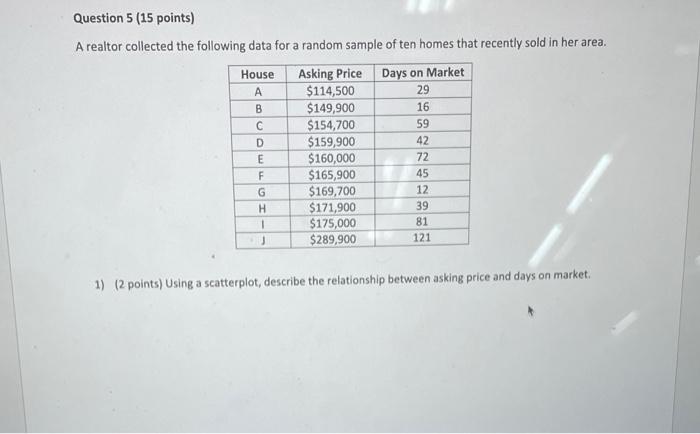
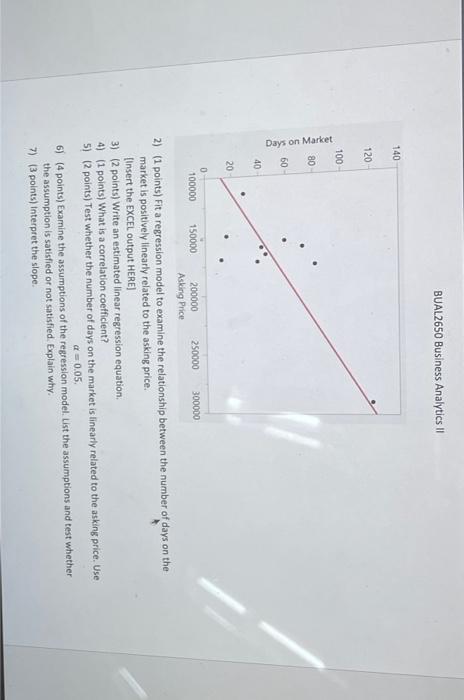
A realtor collected the following data for a random sample of ten homes that recently sold in her area. 1) (2 points) Using a scatterplot, describe the relationship between asking price and days on market. BUAL2650 Business Analytics II 2) (1 points) Fit a regression model to examine the relationship between the number of days on the market is positively linearly related to the asking price. [Insert the EXCEL output HERE] 3) (2 points) Write an estimated linear regression equation. 4) (1 points) What is a correlation coefficient? 5) (2 points) Test whether the number of days on the market is linearly related to the asking price. Use =0.05. 6) (4 points) Examine the assumptions of the regression model. List the assumptions and test whether the assumption is satisfied or not satisfied. Explain why. 7) (3 points) interpret the slope. A realtor collected the following data for a random sample of ten homes that recently sold in her area. 1) (2 points) Using a scatterplot, describe the relationship between asking price and days on market. BUAL2650 Business Analytics II 2) (1 points) Fit a regression model to examine the relationship between the number of days on the market is positively linearly related to the asking price. [Insert the EXCEL output HERE] 3) (2 points) Write an estimated linear regression equation. 4) (1 points) What is a correlation coefficient? 5) (2 points) Test whether the number of days on the market is linearly related to the asking price. Use =0.05. 6) (4 points) Examine the assumptions of the regression model. List the assumptions and test whether the assumption is satisfied or not satisfied. Explain why. 7) (3 points) interpret the slope
Step by Step Solution
There are 3 Steps involved in it

Get step-by-step solutions from verified subject matter experts