

Question: A regression run on Excel using the data shown gave the output shown below data. a) What the value of the Correlation Coefficient between price
A regression run on Excel using the data shown gave the output shown below data. a) What the value of the Correlation Coefficient between price and customer satisfaction? Round your answer to two decimal points. b) What is the Mean Squared Error (MSE) for this regression? Round your answer to two decimal points.
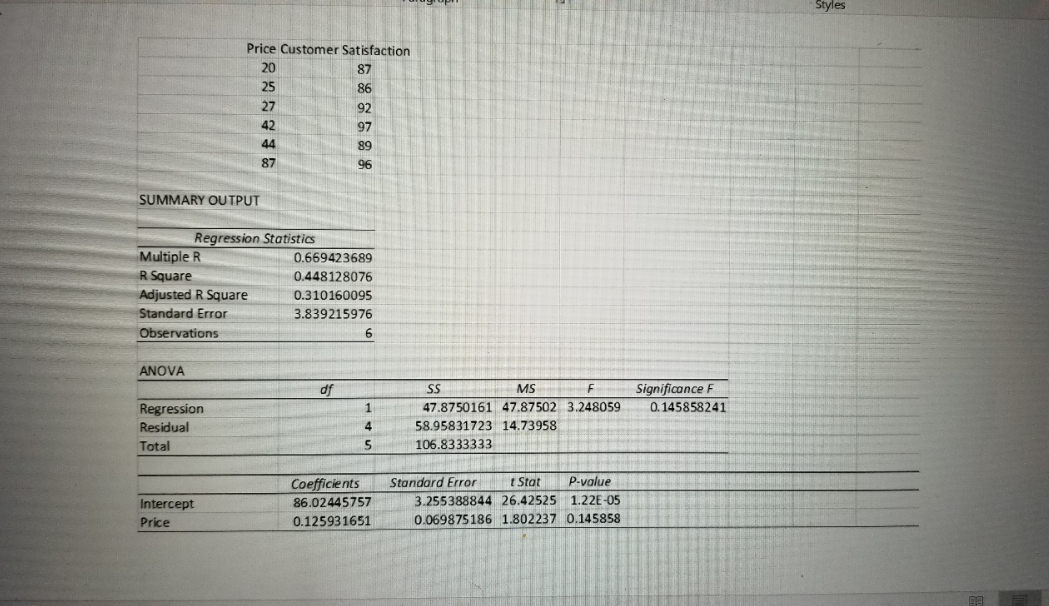
Styles Price Customer Satisfaction 20 87 25 86 27 92 42 97 44 89 87 96 SUMMARY OUTPUT Regression Statistics Multiple R 0.669423689 R Square 0.448128076 Adjusted R Square 0.310160095 Standard Error 3.839215976 Observations 6 ANOVA of 55 MS F Significance F Regression 47.8750161 47.87502 3.248059 0. 145858241 Residual 58.95831723 14.73958 Total 106.8333333 Coefficients Standard Error t Stat P-value Intercept 86.02445757 3.255388844 26.42525 1.226-05 Price 0.125931651 0.069875186 1.802237 0.145858
Step by Step Solution
There are 3 Steps involved in it

Get step-by-step solutions from verified subject matter experts