

Question: A reproducible document containing your analysis for the following problem and submit your R markdown and html files on Canvas. Now that football season is
A reproducible document containing your analysis for the following problem and submit
your R markdown and html files on Canvas.
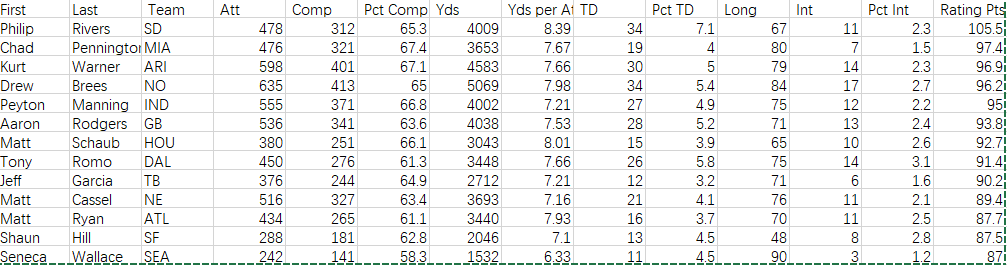
Now that football season is upon us, let's put Linear Algebra to good use! Rating.csv file posted on Canvas
presents quarterback ratings for the 2008 NFL season (The Sports Network).
a. Least Square model to relate the dependent variable quarterback rating to the percentage of completions (Pct Comp).
b. Least Square model to relate the dependent variable quarterback rating to the percentage of
Completions (Pct Comp) and interceptions. (Pct Int)
c. Determine the least square error (square root of sum of square errors) for models in part a and b. Does
using an extra variable, namely percentage of interceptions, improve the accuracy of the model for this
data set? Comment.
d. Use your models in part a and b to predict the rating for a quarterback with percentage of completions
of 60%, and percentage of interceptions of 3%.
Only need part c and d
\f
Step by Step Solution
There are 3 Steps involved in it

Get step-by-step solutions from verified subject matter experts