

Question: A researcher collected data on the height ( (mathrm{cm}) ) of eight legume plants and the number of flowers on the plant one week after
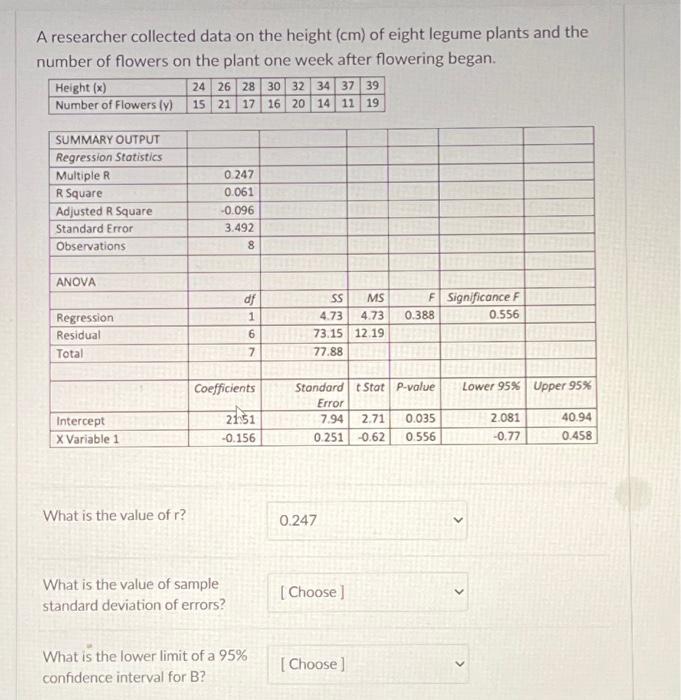
A researcher collected data on the height (cm) of eight legume plants and the number of flowers on the plant one week after flowering began. Height (x) 24 26 28 30 32 34 37 39 Number of Flowers (y) 15 21 17 16 20 14 11 19 SUMMARY OUTPUT Regression Statistics Multiple R 0.247 R Square 0.061 Adjusted R Square -0.096 Standard Error 3.492 Observations 8 ANOVA df Regression 1 SS MS 4.73 4.73 0.388 F Significance F 0.556 Residual 6 73.15 12.19 Total 7 77.88 Coefficients Standard t Stat P-value Lower 95% Upper 95% Intercept X Variable 1 21:51 -0.156 Error 7.94 0.251 -0.62 0.556 1 2.71 0.035 2.081 40.94 -0.77 0.458 What is the value of r? 0.247 What is the value of sample standard deviation of errors? [Choose ] What is the lower limit of a 95% [Choose] confidence interval for B?
Step by Step Solution
There are 3 Steps involved in it

Get step-by-step solutions from verified subject matter experts