

Question: A researcher develops a new theory that predicts that vegetarians will have more of a particular vitamin in their blood than non-vegetarians. An experiment is


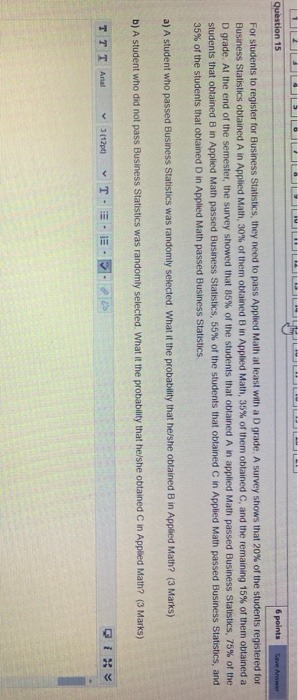
A researcher develops a new theory that predicts that vegetarians will have more
of a particular vitamin in their blood than non-vegetarians. An experiment is
conducted and vegetarians do have more of the vitamin, but the difference is not
significant. The probability value is 0.13. Should the experimenter's confidence
in the theory increase, decrease, or stay the same?
7. A researcher hypothesizes that the lowering in cholesterol associated with
weight loss is really due to exercise. To test this, the researcher carefully controls
for exercise while com- paring the cholesterol levels of a group of subjects who
lose weight by dieting with a control group that does not diet. The difference
between groups in cholesterol is not significant. Can the researcher claim that
weight loss has no effect?
8. A significance test is performed and p = .20. Why can't the experimenter claim
that the probability that the null hypothesis is true is .20?
9. For a drug to be approved by the FDA, the drug must be shown to be safe and
effective. If the drug is significantly more effective than a placebo, then the drug
is deemed effective. What do you know about the effectiveness of a drug once it
has been approved by the FDA (assuming that there has not been a Type I error)?
10. When is it valid to use a one-tailed test? What is the advantage of a one-tailed
test? Give an example of a null hypothesis that would be tested by a one-tailed
test.
(F) What is the 95% confidence interval of the mean time people wait before
farting in front of a romantic partner.
Animal Research (AR) case study
29. (AR) What percentage of the women studied in this sample strongly agreed
(gave a rating of 7) that using animals for research is wrong?
30. (AR) Use the proportion you computed in #29. Compute the 95% confidence
interval on the population proportion of women who strongly agree that animal
research is wrong.
31. (AR) Compute a 95% confidence interval on the difference between the gender
means with respect to their beliefs that animal research is wrong.
ADHD Treatment (AT) case study
32. (AT) What is the correlation between the participants' correct number of
responses after taking the placebo and their correct number of responses after
taking 0.60 mg/kg of MPH? Compute the 95% confidence interval on the
population correlation.
Weapons and Aggression (WA) case study
33. (WA) Recall that the hypothesis is that a person can name an aggressive word
more quickly if it is preceded by a weapon word prime than if it is preceded by
a neutral word prime. The first step in testing this hypothesis is to compute the
difference between (a) the naming time of aggressive words when preceded by
a neutral word prime and (b) the naming time of aggressive words when
preceded by a weapon word prime separately for each of the 32 participants.
That is, compute an - aw for each participant.
a. (WA) Would the hypothesis of this study be supported if the difference were
positive or if it were negative?
b. What is the mean of this difference score?
c. What is the standard deviation of this difference score?
d. What is the 95% confidence interval of the mean difference score?
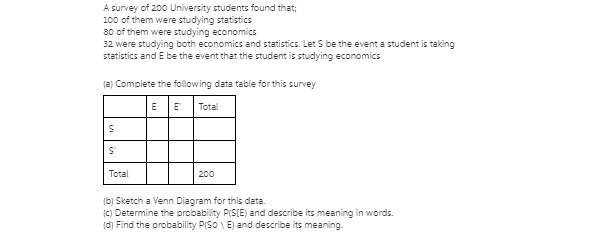
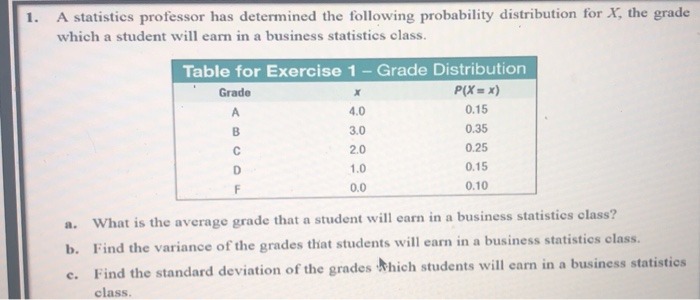

A survey of 200 University students found that; 100 of them were studying statistics 80 of them were studying economics 32 were studying both economics and statistics. Let S be the event a student is taking statistics and E be the event that the student is studying economics [a) Complete the following data table for this survey E E Total S Total 200 [b] Sketch a Venn Diagram for this data. [c) Determine the probability P(S[E) and describe its meaning in words. [d) Find the probability P[S0 ) and describe its meaning-1. A statistics professor has determined the following probability distribution for X, the grade which a student will earn in a business statistics class. Table for Exercise 1 - Grade Distribution Grade X P(X = x) 4.0 0.15 3.0 0.35 2.0 0.25 1.0 0.15 0.0 0.10 a. What is the average grade that a student will earn in a business statistics class? b. Find the variance of the grades that students will earn in a business statistics class. c. Find the standard deviation of the grades which students will earn in a business statistics class.BUSINESS STATISTICS Spring 2018 m Spring 2018
Step by Step Solution
There are 3 Steps involved in it

Get step-by-step solutions from verified subject matter experts