

Question: A researcher would like to predict the dependent variable } from the two independent variables X1 and Xo for a sample of NV = 11
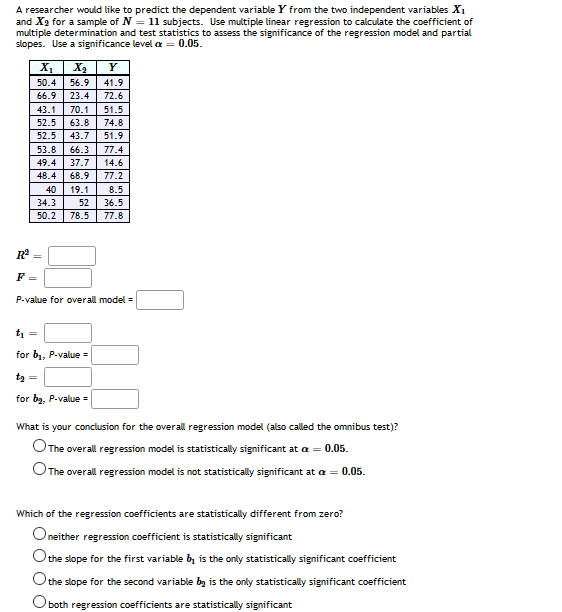
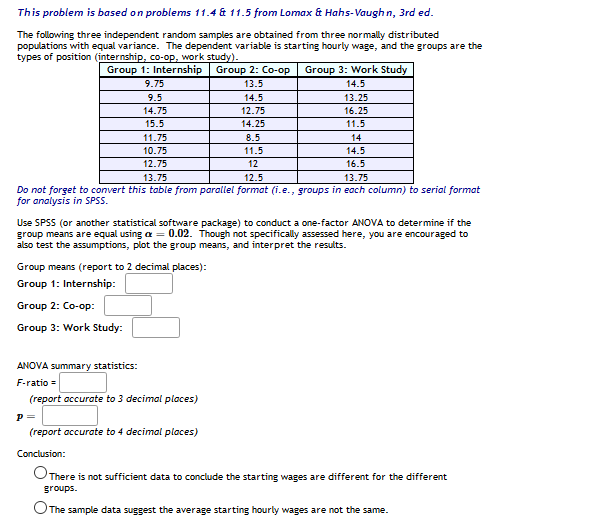
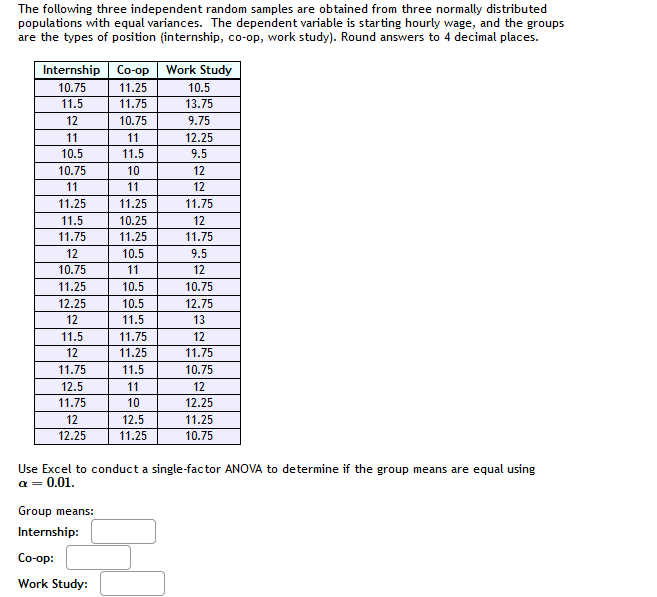
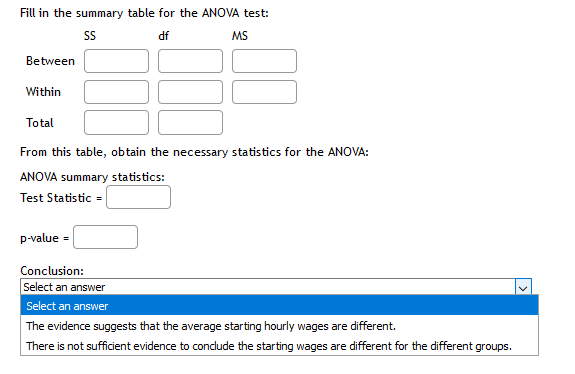
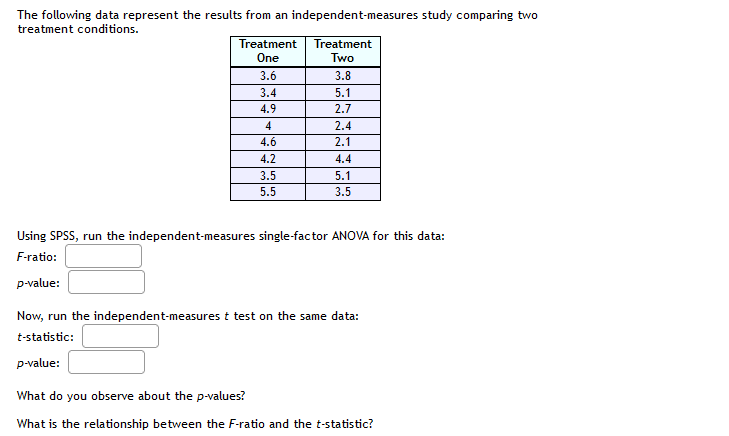
A researcher would like to predict the dependent variable } from the two independent variables X1 and Xo for a sample of NV = 11 subjects. Use multiple linear regression to calculate the coefficient of multiple determination and test statistics to assess the significance of the regression model and partial slopes. Use a significance level a = 0.05. X1 X2 Y 50.4 56.9 41. 66.9 23.4 72.6 43.1 70.1 51.5 52.5 63.8 74.8 52.5 43.7 51. 53.8 66.3 77.4 49.4 37.7 14.6 48.4 68.9 77.2 40 19.1 8.5 34.3 52 36.5 2 78.5 77.8 72 P-value for overall model = t1 for by, P-value = to = for by, P-value = What is your conclusion for the overall regression model (also called the omnibus test)? The overall regression model is statistically significant at a = 0.05. The overall regression model is not statistically significant at a = 0.05. Which of the regression coefficients are statistically different from zero? Oneither regression coefficient is statisticaly significant O the slope for the first variable by is the only statistically significant coefficient the slope for the second variable by is the only statistically significant coefficient both regression coefficients are statistically significantThis problem is based on problems 11.4 & 11.5 from Lomax & Hahs-Vaughn, 3rd ed. The following three independent random samples are obtained from three normally distributed populations with equal variance. The dependent variable is starting hourly wage, and the groups are the types of position (internship, co-op, work study). Group 1: Internship | Group 2: Co-op Group 3: Work Study 9.75 13.5 14.5 9.5 14.5 13.25 14.75 12.75 16.25 15.5 14.25 11.5 11.75 B.5 14 10.75 11.5 14.5 12.75 12 16.5 13.75 12.5 13.75 Do not forget to convert this table from parallel format (i.e., groups in each column) to serial format for analysis in SPSS. Use SP55 (or another statistical software package) to conduct a one-factor ANOVA to determine if the group means are equal using o = 0.02. Though not specifically assessed here, you are encouraged to also test the assumptions, plot the group means, and interpret the results. Group means (report to 2 decimal places): Group 1: Internship: Group 2: Co-op: Group 3: Work Study: ANOVA summary statistics: F-ratio = (report accurate to 3 decimal places) P = (report accurate to 4 decimal places) Conclusion: There is not sufficient data to conclude the starting wages are different for the different groups. The sample data suggest the average starting hourly wages are not the same.The following three independent random samples are obtained from three normally distributed populations with equal variances. The dependent variable is starting hourly wage, and the groups are the types of position (internship, co-op, work study). Round answers to 4 decimal places. Internship Co-op Work Study 10.75 11.25 10.5 11.5 11.75 13.75 12 10.75 9.75 11 11 12.25 10.5 11.5 3.5 10.75 10 12 11 11 12 11.25 11.25 11.75 11.5 10.25 12 11.75 11.25 11.75 12 10.5 1.5 10.75 11 12 11.25 10.5 10.75 12.25 10.5 12.75 12 1 .5 13 11.5 11.75 12 12 11.25 11.75 11.75 11.5 10.75 12.5 11 12 11.75 10 12.25 12 12.5 11.25 12.25 11.25 10.75 = 0.01. Use Excel to conduct a single-factor ANOVA to determine if the group means are equal using Group means: Internship: Co-op: Work Study:Fill in the summary table for the ANOVA test: 5S df MS Between Within Total From this table, obtain the necessary statistics for the ANOVA: ANOVA summary statistics: Test Statistic = p-value = Conclusion: Select an answer Select an answer The evidence suggests that the average starting hourly wages are different. There is not sufficient evidence to condude the starting wages are different for the different groups.The following data represent the results from an independent-measures study comparing two treatment conditions. Treatment Treatment One Two 3.6 3.8 3.4 5.1 4.9 2.7 4 2.4 4.6 2.1 4.2 4.4 3.5 5.1 5.5 3.5 Using SPSS, run the independent-measures single-factor ANOVA for this data: F-ratio: p-value: Now, run the independent-measures & test on the same data: t-statistic: p-value: What do you observe about the p-values? What is the relationship between the F-ratio and the t-statistic
Step by Step Solution
There are 3 Steps involved in it

Get step-by-step solutions from verified subject matter experts