

Question: A restaurant chain collected data on total fat (denoted by fat) in grams and the protein content in grams for various items on their menu.
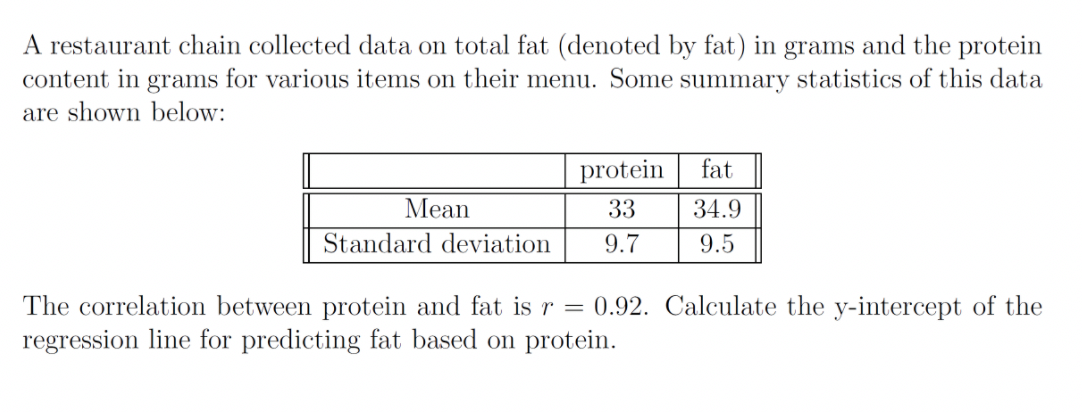
A restaurant chain collected data on total fat (denoted by fat) in grams and the protein content in grams for various items on their menu. Some summary statistics of this data are shown below: | protein fat I |_ | I Standard deviation _ I The correlation between protein and fat is r = 0.92. Calculate the yintercept of the regression line for predicting fat based on protein. 50% \"to
Step by Step Solution
There are 3 Steps involved in it
1 Expert Approved Answer
Step: 1 Unlock

Question Has Been Solved by an Expert!
Get step-by-step solutions from verified subject matter experts
Step: 2 Unlock
Step: 3 Unlock