

Question: A retail store sells space heaters. Sales data for four years is provided in the tab Space Heaters . Please help me - I am
A retail store sells space heaters. Sales data for four years is provided in the tab Space Heaters. Please help me - I am having trouble doing this problems in excel.
| Year | Quarter | Sales |
| 1 | 1 | 810 |
| 1 | 2 | 481 |
| 1 | 3 | 732 |
| 1 | 4 | 436 |
| 2 | 1 | 1025 |
| 2 | 2 | 781 |
| 2 | 3 | 877 |
| 2 | 4 | 545 |
| 3 | 1 | 1217 |
| 3 | 2 | 940 |
| 3 | 3 | 1190 |
| 3 | 4 | 727 |
| 4 | 1 | 1399 |
| 4 | 2 | 1200 |
| 4 | 3 | 1236 |
| 4 | 4 | 853 |
A) Plot the time series. Describe the time series in a few sentences. 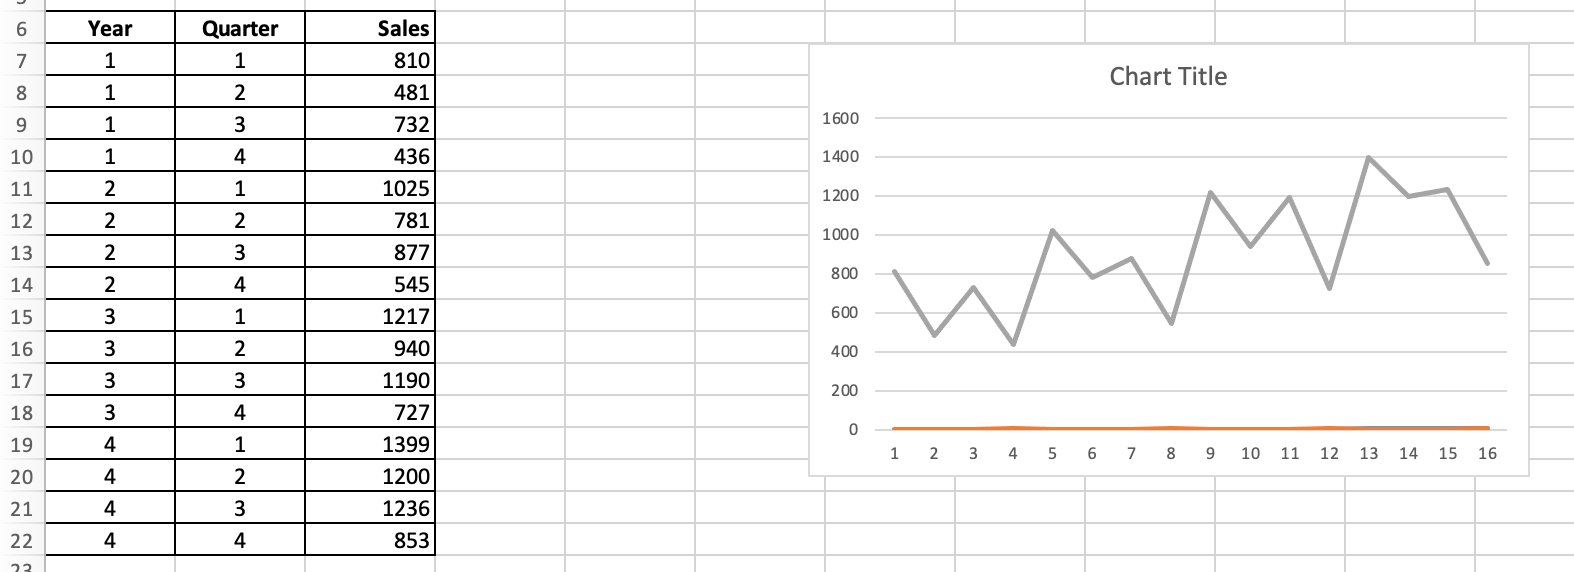 does the chart look correct??
B) Calculate the seasonal index for each quarter. What are the implications of these indexes?
C) Calculate the trend equation for this data. Explain what the slope and intercept mean in this context.
D) Using the multiplicative decomposition method calculate forecasts for each quarter of Year 5.
Step by Step Solution
There are 3 Steps involved in it
1 Expert Approved Answer
Step: 1 Unlock

Question Has Been Solved by an Expert!
Get step-by-step solutions from verified subject matter experts
Step: 2 Unlock
Step: 3 Unlock