

Question: a. Salary b. Mobile number. C. I.Q. d. Temperature e. Ranking of a T.V show. Discrete Variable Continuous Variable Qualitative Quantitative a. Salary Discrete Continuous
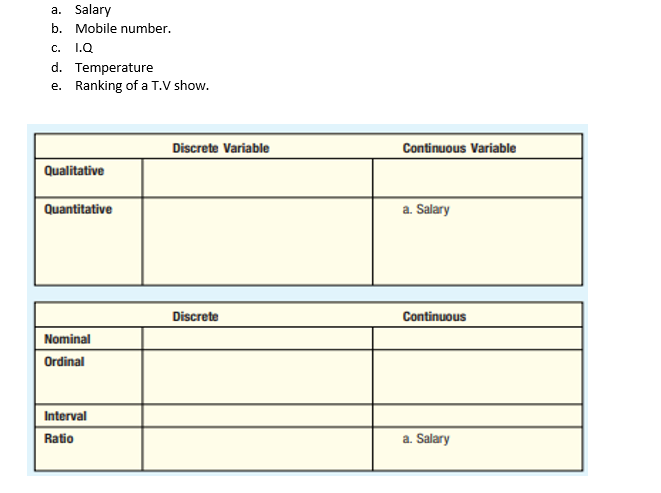
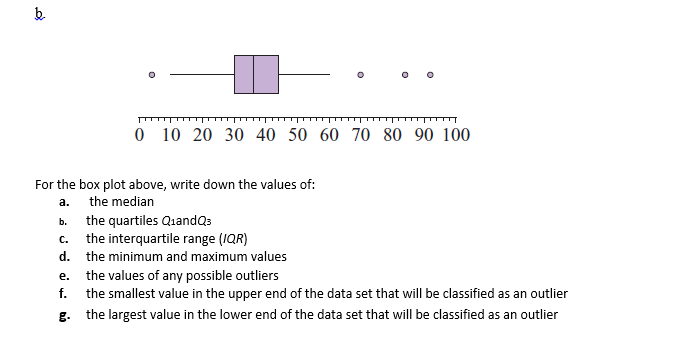
a. Salary b. Mobile number. C. I.Q. d. Temperature e. Ranking of a T.V show. Discrete Variable Continuous Variable Qualitative Quantitative a. Salary Discrete Continuous Nominal Ordinal Interval Ratio a. Salaryb O ITTTTT TTT ITTTTTTTT 0 10 20 30 40 50 60 70 80 90 100 For the box plot above, write down the values of: a. the median b. the quartiles QuandQ3 C. the interquartile range (/QR) d. the minimum and maximum values e. the values of any possible outliers f. the smallest value in the upper end of the data set that will be classified as an outlier g. the largest value in the lower end of the data set that will be classified as an outlier
Step by Step Solution
There are 3 Steps involved in it

Get step-by-step solutions from verified subject matter experts