

Question: ( a ) Sam collected data on how much sleep he got each night for a week. His results are collected in the table shown
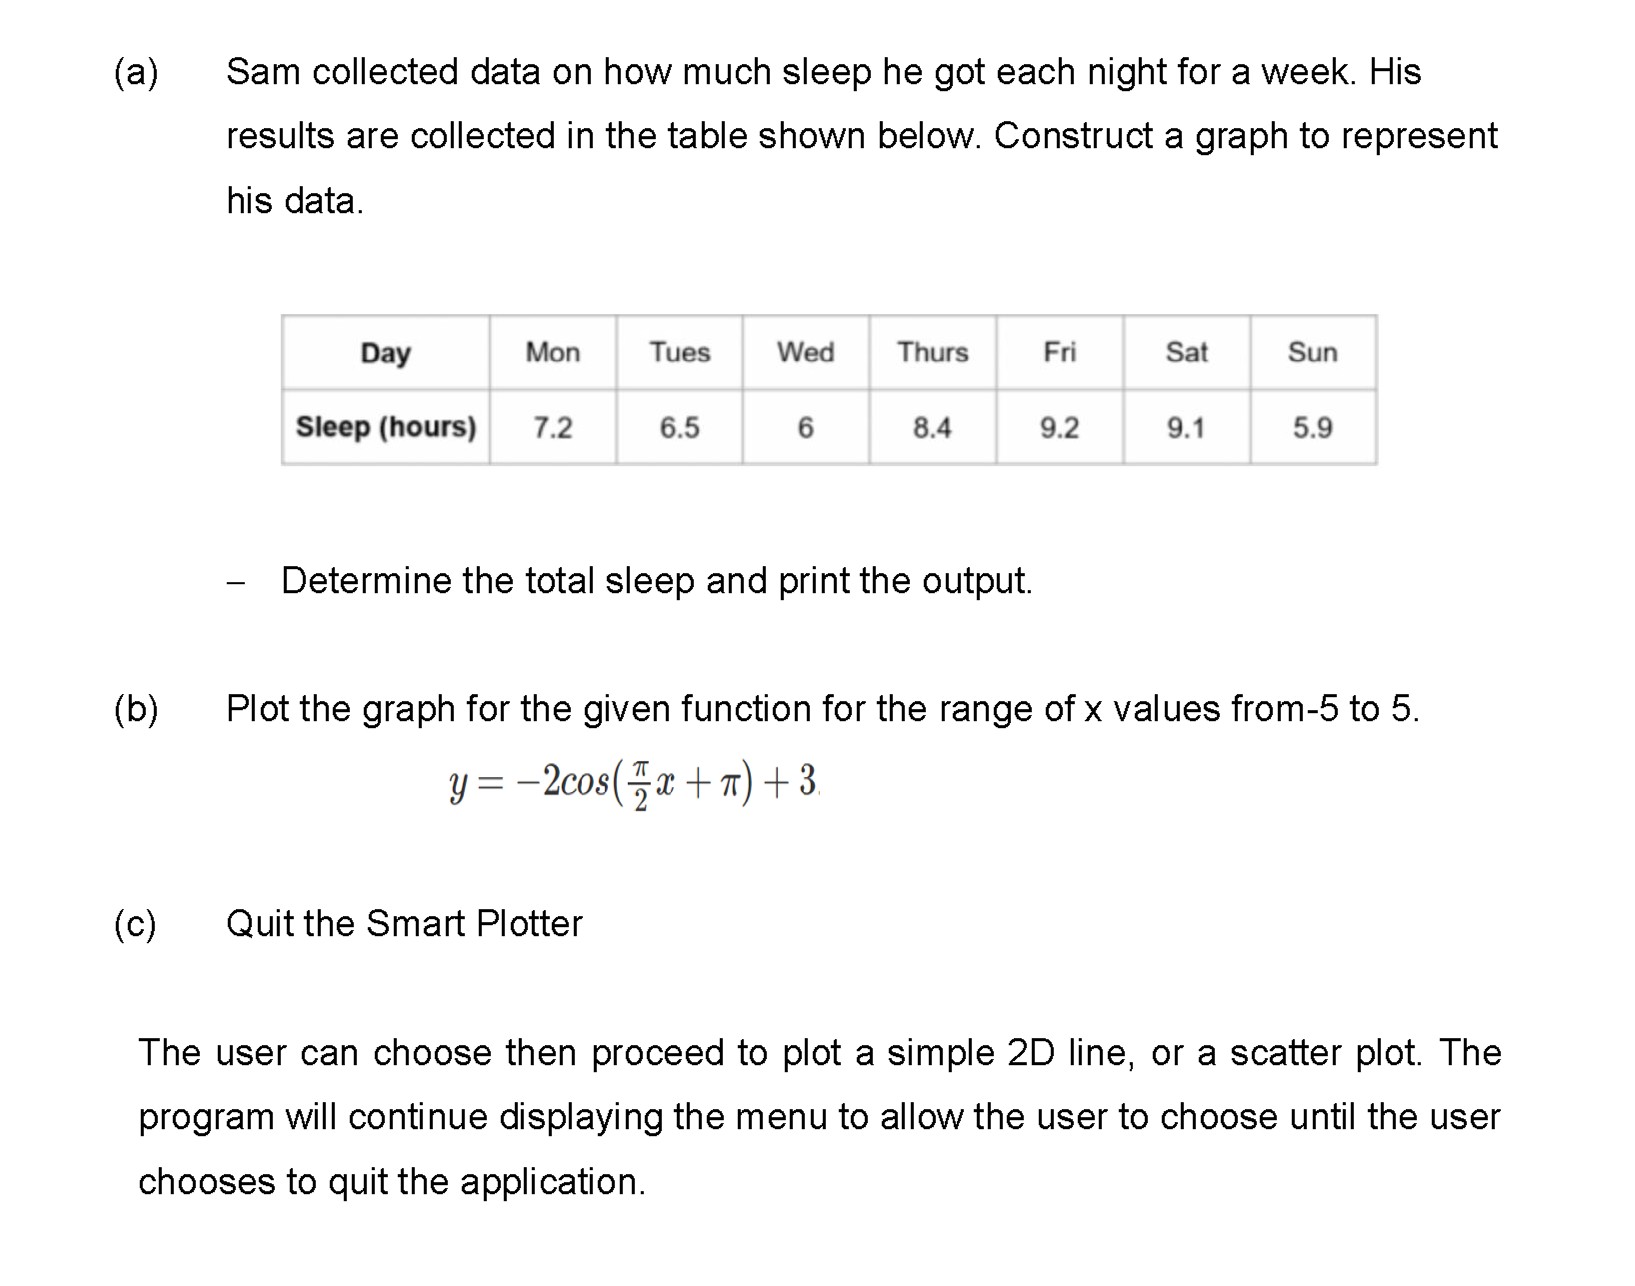
a Sam collected data on how much sleep he got each night for a week. His
results are collected in the table shown below. Construct a graph to represent
his data.
Determine the total sleep and print the output.
b Plot the graph for the given function for the range of values from to
c Quit the Smart Plotter
The user can choose then proceed to plot a simple D line, or a scatter plot. The
program will continue displaying the menu to allow the user to choose until the user
chooses to quit the application.
Step by Step Solution
There are 3 Steps involved in it
1 Expert Approved Answer
Step: 1 Unlock

Question Has Been Solved by an Expert!
Get step-by-step solutions from verified subject matter experts
Step: 2 Unlock
Step: 3 Unlock