

Question: A Sample 1 Sample 2 38 33 61 61 29 43 60 53 71 77 30 45 49 59 35 41 26 20 70 83
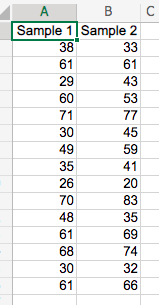
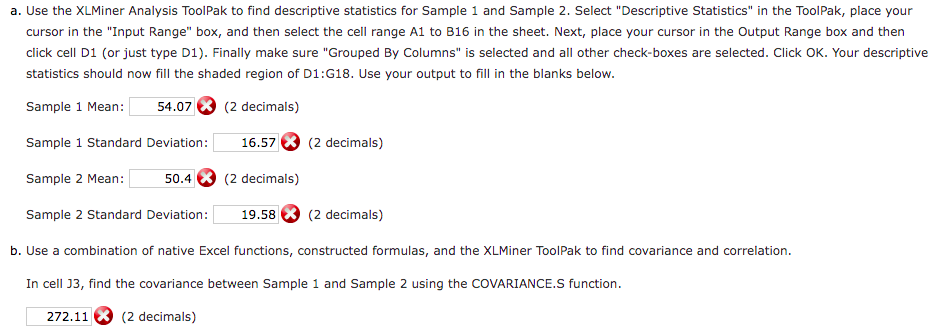
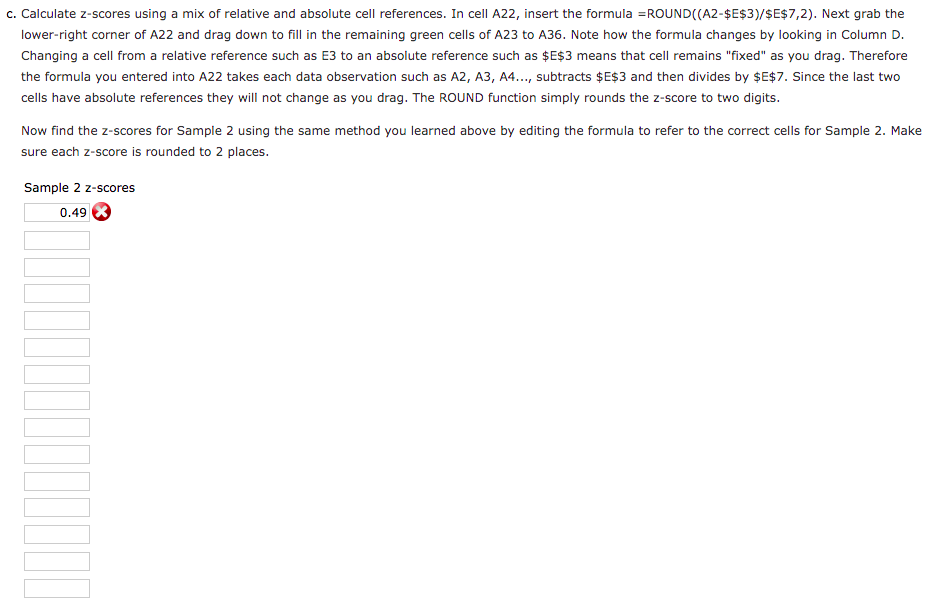
A Sample 1 Sample 2 38 33 61 61 29 43 60 53 71 77 30 45 49 59 35 41 26 20 70 83 48 35 61 69 68 74 30 32 61 66 B C a. Use the XLMiner Analysis ToolPak to find descriptive statistics for Sample 1 and Sample 2. Select "Descriptive Statistics" in the ToolPak, place your cursor in the "Input Range" box, and then select the cell range A1 to B16 in the sheet. Next, place your cursor in the Output Range box and then click cell D1 (or just type D1). Finally make sure "Grouped By Columns" is selected and all other check-boxes are selected. Click OK. Your descriptive statistics should now fill the shaded region of D1:G18. Use your output to fill in the blanks below. Sample 1 Mean: 54.07 (2 decimals) Sample 1 Standard Deviation: 16.57X (2 decimals) Sample 2 Mean: 50.4 (2 decimals) Sample 2 Standard Deviation: 19.58 (2 decimals) b. Use a combination of native Excel functions, constructed formulas, and the XLMiner ToolPak to find covariance and correlation. In cell J3, find the covariance between Sample 1 and Sample 2 using the COVARIANCE.S function. 272.11 (2 decimals) c. Calculate z-scores using a mix of relative and absolute cell references. In cell A22, insert the formula =ROUND ((A2-$E$3)/$E$7,2). Next grab the lower-right corner of A22 and drag down to fill in the remaining green cells of A23 to A36. Note how the formula changes by looking in Column D. Changing a cell from a relative reference such as E3 to an absolute reference such as $E$3 means that cell remains "fixed" as you drag. Therefore the formula you entered into A22 takes each data observation such as A2, A3, A4..., subtracts $E$3 and then divides by $E$7. Since the last two cells have absolute references they will not change as you drag. The ROUND function simply rounds the z-score to two digits. Now find the z-scores for Sample 2 using the same method you learned above by editing the formula to refer to the correct cells for Sample 2. Make sure each z-score is rounded to 2 places. 2 z-scores Sample 0.49 A Sample 1 Sample 2 38 33 61 61 29 43 60 53 71 77 30 45 49 59 35 41 26 20 70 83 48 35 61 69 68 74 30 32 61 66 B C a. Use the XLMiner Analysis ToolPak to find descriptive statistics for Sample 1 and Sample 2. Select "Descriptive Statistics" in the ToolPak, place your cursor in the "Input Range" box, and then select the cell range A1 to B16 in the sheet. Next, place your cursor in the Output Range box and then click cell D1 (or just type D1). Finally make sure "Grouped By Columns" is selected and all other check-boxes are selected. Click OK. Your descriptive statistics should now fill the shaded region of D1:G18. Use your output to fill in the blanks below. Sample 1 Mean: 54.07 (2 decimals) Sample 1 Standard Deviation: 16.57X (2 decimals) Sample 2 Mean: 50.4 (2 decimals) Sample 2 Standard Deviation: 19.58 (2 decimals) b. Use a combination of native Excel functions, constructed formulas, and the XLMiner ToolPak to find covariance and correlation. In cell J3, find the covariance between Sample 1 and Sample 2 using the COVARIANCE.S function. 272.11 (2 decimals) c. Calculate z-scores using a mix of relative and absolute cell references. In cell A22, insert the formula =ROUND ((A2-$E$3)/$E$7,2). Next grab the lower-right corner of A22 and drag down to fill in the remaining green cells of A23 to A36. Note how the formula changes by looking in Column D. Changing a cell from a relative reference such as E3 to an absolute reference such as $E$3 means that cell remains "fixed" as you drag. Therefore the formula you entered into A22 takes each data observation such as A2, A3, A4..., subtracts $E$3 and then divides by $E$7. Since the last two cells have absolute references they will not change as you drag. The ROUND function simply rounds the z-score to two digits. Now find the z-scores for Sample 2 using the same method you learned above by editing the formula to refer to the correct cells for Sample 2. Make sure each z-score is rounded to 2 places. 2 z-scores Sample 0.49
Step by Step Solution
There are 3 Steps involved in it

Get step-by-step solutions from verified subject matter experts