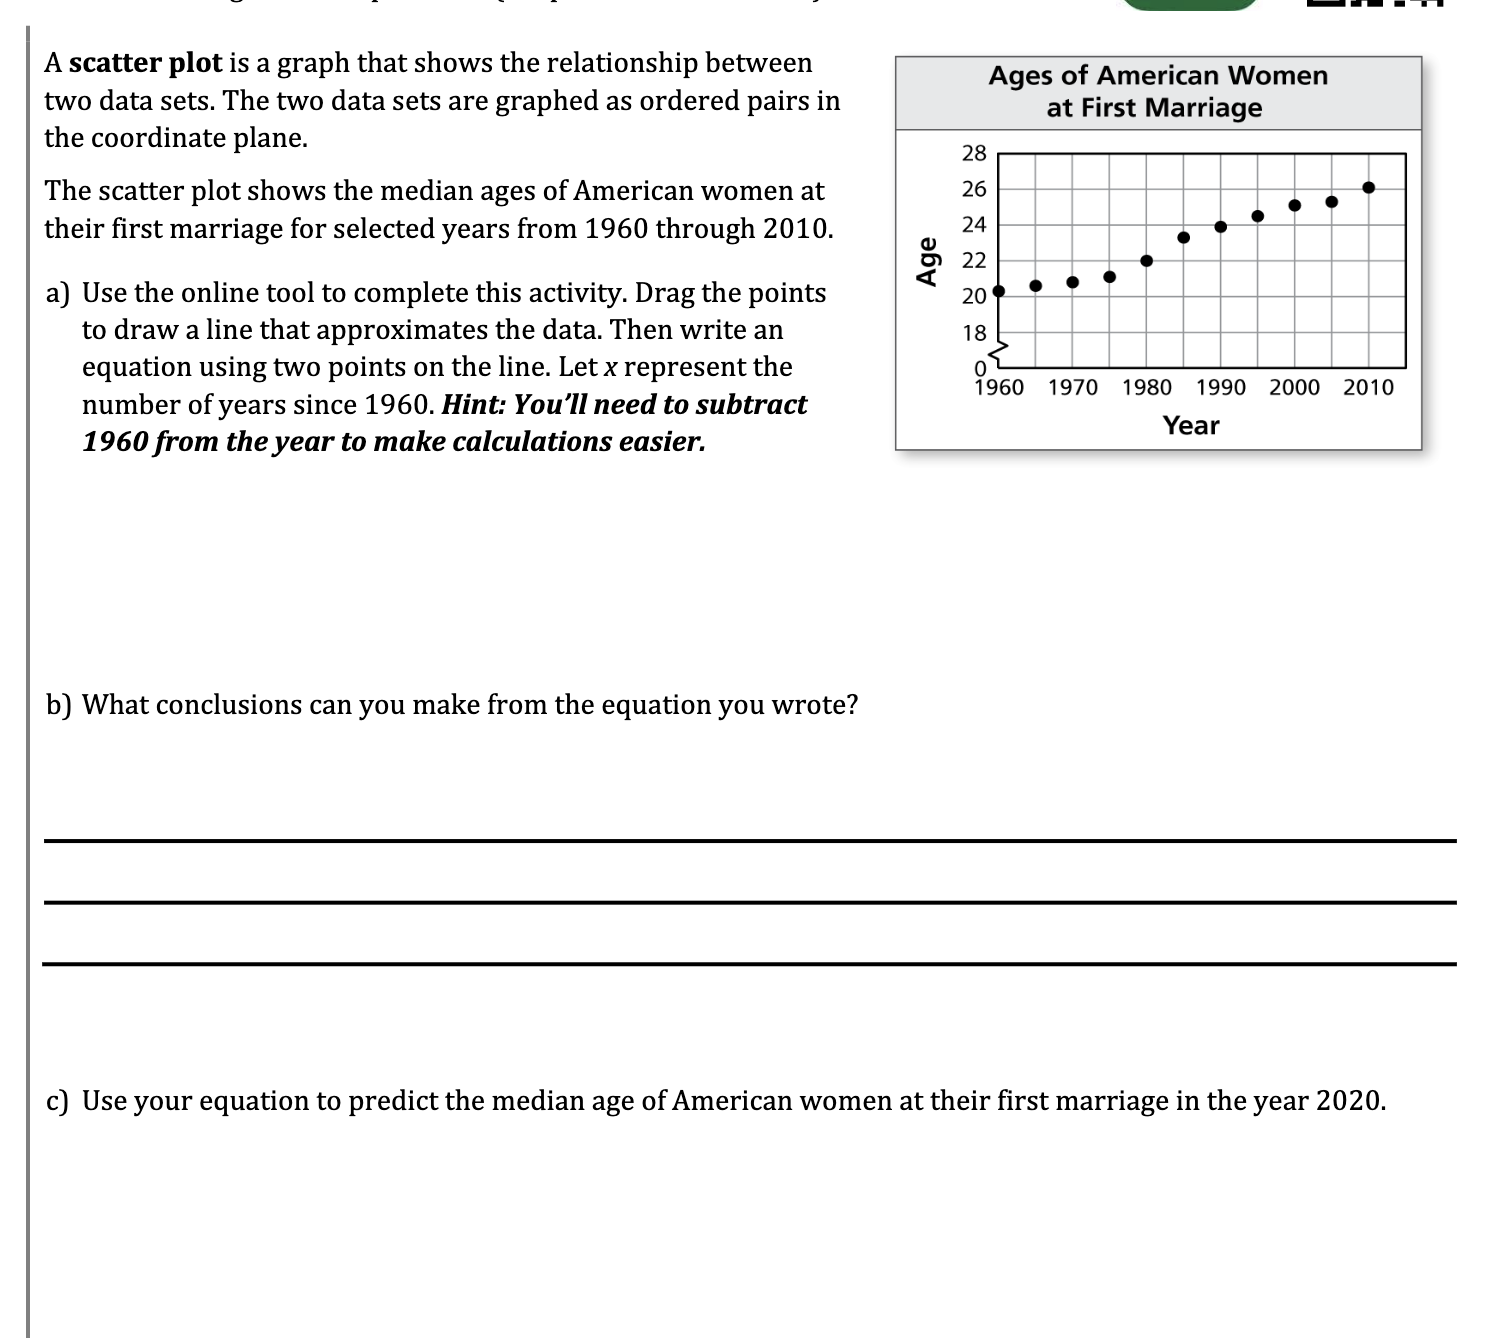
Question: A scatter plot is a graph that shows the relationship between Ages of American Women two data sets. The two data sets are graphed as

A scatter plot is a graph that shows the
A scatter plot is a graph that shows the relationship between Ages of American Women two data sets. The two data sets are graphed as ordered pairs in at First Marriage the coordinate plane. 28 The scatter plot shows the median ages of American women at 26 their first marriage for selected years from 1960 through 2010. 24 22 a) Use the online tool to complete this activity. Drag the points 20 to draw a line that approximates the data. Then write an 18 equation using two points on the line. Let x represent the OL 1960 1970 1980 1990 2000 2010 number of years since 1960. Hint: You'll need to subtract 1960 from the year to make calculations easier. Year b) What conclusions can you make from the equation you wrote? c) Use your equation to predict the median age of American women at their first marriage in the year 2020

Step by Step Solution

There are 3 Steps involved in it

1 Expert Approved Answer
Step: 1 Unlock blur-text-image
Question Has Been Solved by an Expert!

Get step-by-step solutions from verified subject matter experts

Step: 2 Unlock
Step: 3 Unlock

Students Have Also Explored These Related Mathematics Questions!