

Question: A scatter plot of the data show us: i. Which of the following values is to be r? You can calculate this or estimate this
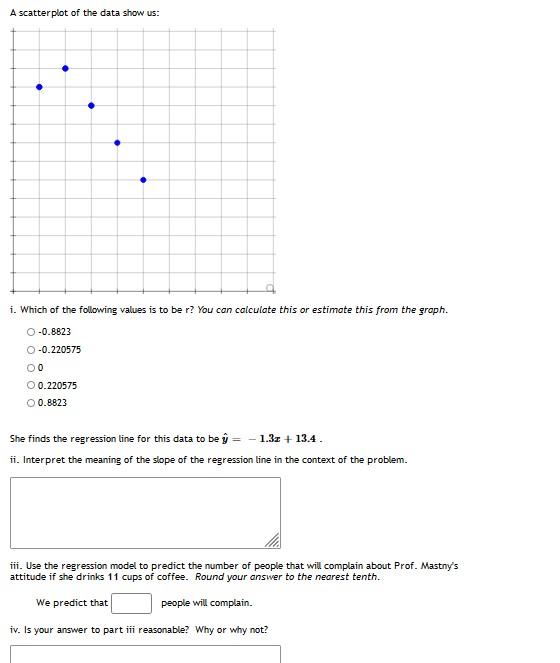
A scatter plot of the data show us: i. Which of the following values is to be r? You can calculate this or estimate this from the graph. O -0.8823 O -0.220575 O0 O0.220575 O 0.8823 She finds the regression line for this data to be y = - 1.3x + 13.4. ii. Interpret the meaning of the slope of the regression line in the context of the problem. iii. Use the regression model to predict the number of people that will complain about Prof. Mastny's attitude if she drinks 11 cups of coffee. Round your answer to the nearest tenth. We predict that people will complain. iv. Is your answer to part fii reasonable? Why or why not
Step by Step Solution
There are 3 Steps involved in it
1 Expert Approved Answer
Step: 1 Unlock

Question Has Been Solved by an Expert!
Get step-by-step solutions from verified subject matter experts
Step: 2 Unlock
Step: 3 Unlock