

Question: A scatter plot or scatter diagram is a graphicaldisplay involving two variables.The data values are representedas pointson a coordinate plane. f$700 $600 $500 $400 $300
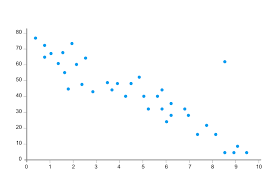
Ascatter plotorscatter diagramis a graphicaldisplay involving two variables.The data values are representedas pointson a coordinate plane.

\f$700 $600 $500 $400 $300 $200 $100 $0 10 12 14 16 18 20 Temperature C 22 24 26
Step by Step Solution
There are 3 Steps involved in it
1 Expert Approved Answer
Step: 1 Unlock

Question Has Been Solved by an Expert!
Get step-by-step solutions from verified subject matter experts
Step: 2 Unlock
Step: 3 Unlock