

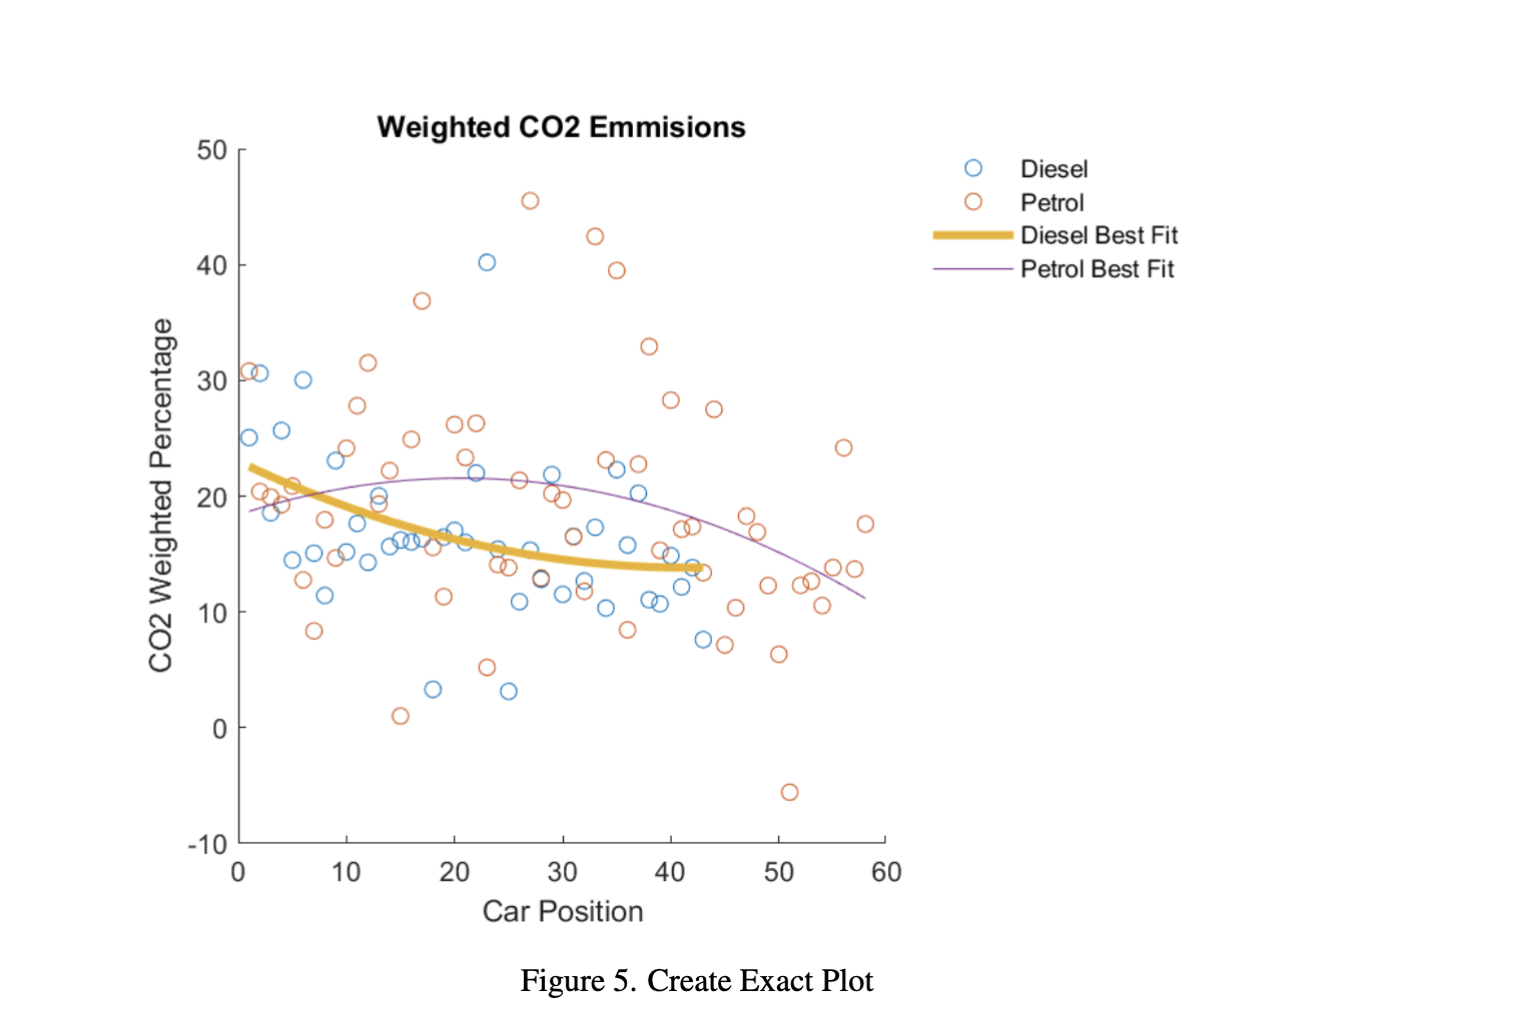
Question: A scatter plot showing the weighted CO 2 Percentage ( Column 1 9 ) for each car. A line of best fit of degree 2
A scatter plot showing the weighted CO Percentage Column for each car. A line of best fit of degree is also potted. i For the scatter plot, sort the cars by ascending alphabetical order Matlab.
Figure Create Exact Plot
Step by Step Solution
There are 3 Steps involved in it
1 Expert Approved Answer
Step: 1 Unlock

Question Has Been Solved by an Expert!
Get step-by-step solutions from verified subject matter experts
Step: 2 Unlock
Step: 3 Unlock