

Question: A scatterplot of 420 observations on test scores (TestScore) and percentage of students in the district who are English learners (PctEL) is shown in
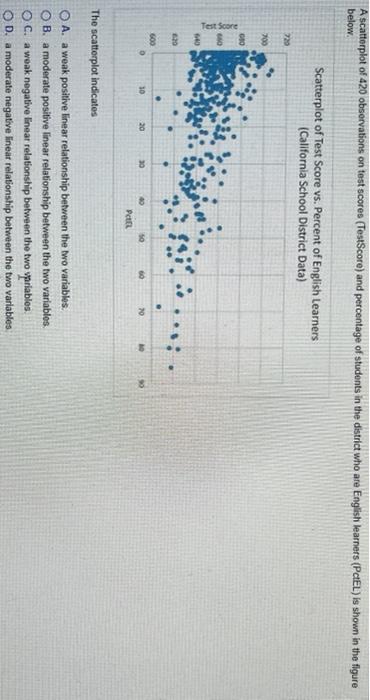
A scatterplot of 420 observations on test scores (TestScore) and percentage of students in the district who are English learners (PctEL) is shown in the figure below. Scatterplot of Test Score vs. Percent of English Learners (California School District Data) Test Score 720 700 640 640 620 600 D 10 20 30 40 50 60 70 PCEL The scatterplot indicates OA. a weak positive linear relationship between the two variables. OB. a moderate positive linear relationship between the two variables. OC. a weak negative linear relationship between the two variables. OD. a moderate negative linear relationship between the two variables
Step by Step Solution
There are 3 Steps involved in it

Get step-by-step solutions from verified subject matter experts