

Question: A school educator is interested in determining the relationships between grade point average (GPA) and IQ scores among ninth graders. The educator takes a random
A school educator is interested in determining the relationships between grade point average (GPA) and IQ scores among ninth graders. The educator takes a random sample of 40 ninth graders aged 14 years old and administers the Wechsler Intelligence Scale for Children-Fourth Edition (WISC-IV). The WISC-IV includes a Full Scale IQ (FSIQ; however for this assignment we will just call it IQ) that comprises verbal comprehension, perceptual reasoning, working memory, and processing speed skills.
Answer the following Questions:
a. Hypothesis - Formulate a hypothesis about the two variables. What do youthinkis the relationship between IQ scores and GPA?
b. Variables - Identify the variables and each of their attributes: discrete or continuous, quantitative or categorical, scale of measurement (nominal, ordinal, interval, or ratio), and independent or dependent.
c.Descriptive statistics - What are descriptive statistics and the appropriate and necessary statistical results?
oHow do the measures of central tendency and variability provide us with an overview of the characteristics and shape of the distribution of each variable?What are these statistic
oKeeping in mind that the WISC-IV has a mean of 100 and Standard Deviation of 15, what assumptions could you make about the IQ scores and suitability of this IQ test for the group of students sampled?
oKeeping in mind that the WISC-IV has a mean of 100 and Standard Deviation of 15, how many students' IQ scores in this sample are within one standard deviation below the test's mean? Two standard deviations below the test's mean? What percentage of students in this sample had an IQ score less than or equal to 70? An IQ score greater or equal to 100?
d. Correlation - From the chart, what are the results of the correlation and the statistical results?
oIs there a significant correlation between IQ scores and GPA? If so, what does a significant correlation mean?
oUsing the correlation table and scatterplot, explain what is the relationship is positive, negative, or no correlation.
oDescribe the strength of the relationship (e.g. very strong, moderate, weak, etc.).
oWhat do the results tell us about our hypotheses?
oWhat conclusions can we draw from these results?What conclusions can we NOT make using these results?
oWhat issues regarding the sample used or how the data was collected should be considered in the interpretation of the data?
e. Regression - What are the results of the regression including the appropriate and necessary statistical results? In the the regression, what variable is the dependent variable and what variable is the independent variable?
oWhat do the regression results tell us about IQ scores and GPA?
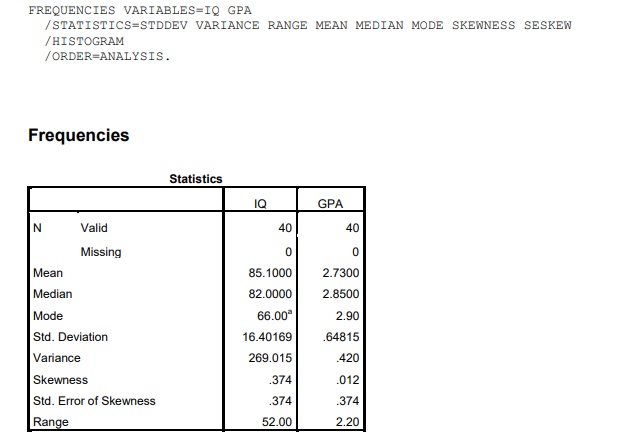
FREQUENCIES VARIABLES=IQ GPA /STATISTICS-STDDEV VARIANCE RANGE MEAN MEDIAN MODE SKEWNESS SESKEW /HISTOGRAM /ORDER=ANALYSIS. Frequencies Statistics 10 GPA N Valid 40 40 Missing 0 0 Mean 85.1000 2.7300 Median 82.0000 2.8500 Mode 66.00# 2.90 Std. Deviation 16.40169 64815 Variance 269.015 .420 Skewness 374 012 Std. Error of Skewness .374 374 Range 52.00 2.20
Step by Step Solution
There are 3 Steps involved in it

Get step-by-step solutions from verified subject matter experts