

Question: A scientist studies how fast a ball will fall when dropped from a height. He drops a ball from different heights and measures the time
A scientist studies how fast a ball will fall when dropped from a height. He drops a ball from different heights and measures the time it takes the ball to reach the ground.
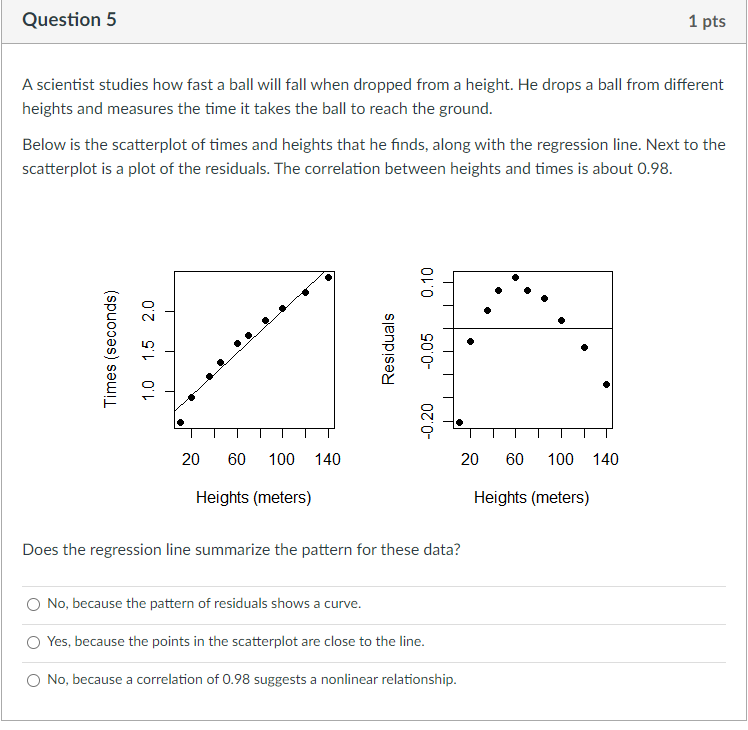
Below is the scatterplot of times and heights that he finds, along with the regression line. Next to the scatterplot is a plot of the residuals. The correlation between heights and times is about 0.98.
Does the regression line summarize the pattern for these data?
Group of answer choices
No, because the pattern of residuals shows a curve.
Yes, because the points in the scatterplot are close to the line.
No, because a correlation of 0.98 suggests a nonlinear relationship.
Question 5 1 pts A scientist studies how fast a ball will fall when dropped from a height. He drops a ball from different heights and measures the time it takes the ball to reach the ground. Below is the scatterplot of times and heights that he nds. along with the regression line. Next to the scatterplot is a plot of the residuals. The correlation between heights and times is about I193. E to :1 E [I] :11 II 2t] t] Hit] 14D 2t] t] Hit] 14D Heights {meters} Heights {meters} Does the regression line summarize the pattern for these data? C} No, because the pattem of residuals shows a curve. 0 Yes. because the points in the scatterplot are close to the line. C} No, because a correlation of [L98 suggests a nonlinear relationship
Step by Step Solution
There are 3 Steps involved in it

Get step-by-step solutions from verified subject matter experts