

Question: A script for plotting a function is provided below. However, the script results in an error in MATLAB. What should be done to make
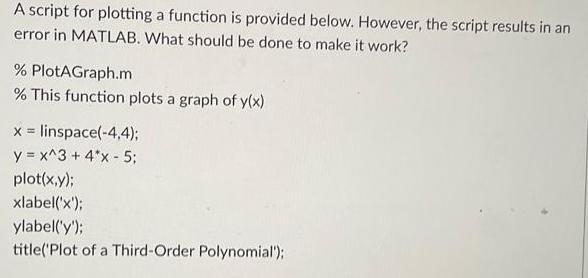
A script for plotting a function is provided below. However, the script results in an error in MATLAB. What should be done to make it work? % PlotAGraph.m % This function plots a graph of y(x) x = linspace(-4,4); y = x^3 + 4*x-5; plot(x,y); xlabel('x'); ylabel('y'); title('Plot of a Third-Order Polynomial');
Step by Step Solution
There are 3 Steps involved in it
1 Expert Approved Answer
Step: 1 Unlock

Question Has Been Solved by an Expert!
Get step-by-step solutions from verified subject matter experts
Step: 2 Unlock
Step: 3 Unlock