

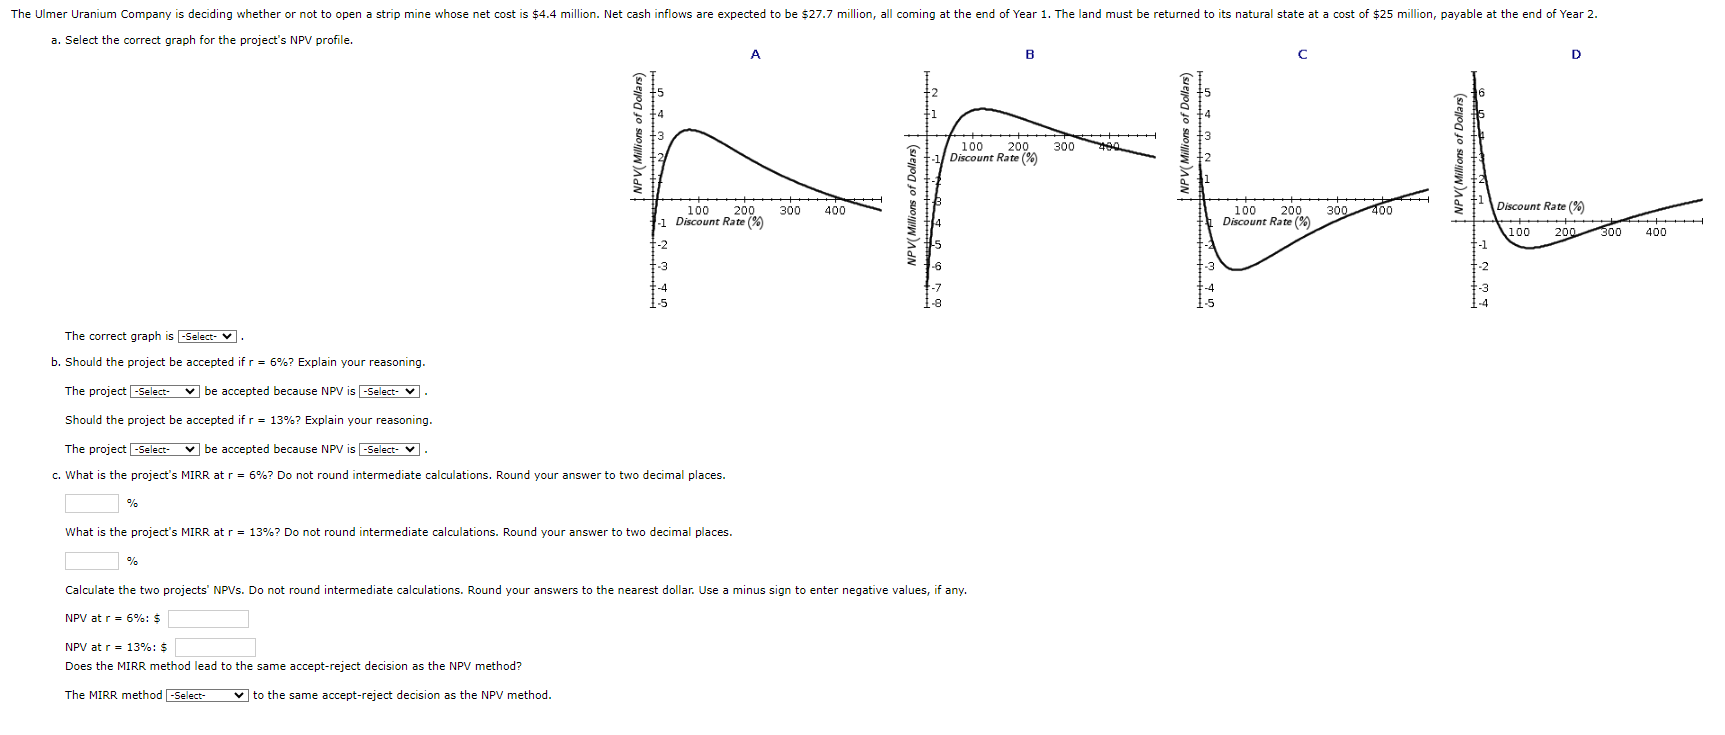
Question: a . Select the correct graph for the project's NPV profile. The correct graph is b . Should the project be accepted if r =
a Select the correct graph for the project's NPV profile.
The correct graph is
b Should the project be accepted if Explain your reasoning.
The project Select be accepted because NPV is Select
Should the project be accepted if Explain your reasoning.
The project be accepted because NPV is Select
c What is the project's MIRR at Do not round intermediate calculations. Round your answer to two decimal places.
What is the project's MIRR at Do not round intermediate calculations. Round your answer to two decimal places.
Calculate the two projects' NPVs Do not round intermediate calculations. Round your answers to the nearest dollar. Use a minus sign to enter negative values, if any.
NPV at :$
NPV at :$
Does the MIRR method lead to the same acceptreject decision as the NPV method?
The MIRR method select to the same acceptreject decision as the NPV method.
Step by Step Solution
There are 3 Steps involved in it
1 Expert Approved Answer
Step: 1 Unlock

Question Has Been Solved by an Expert!
Get step-by-step solutions from verified subject matter experts
Step: 2 Unlock
Step: 3 Unlock