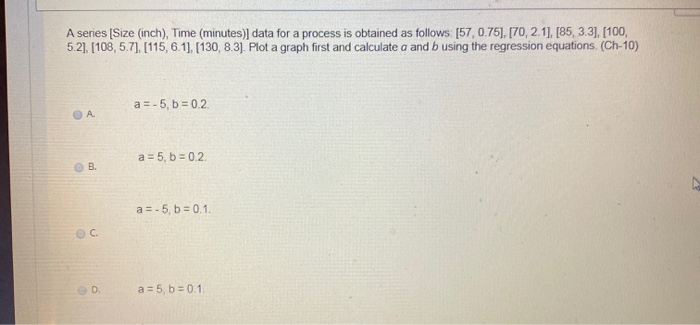
Question: A series (Size (inch), Time (minutes) data for a process is obtained as follows: [57, 0.75), [70, 2.1], [85, 3.3), (100, 5.2]. [108,5,7). [115, 6.1).

A series (Size (inch), Time (minutes) data for a
A series (Size (inch), Time (minutes) data for a process is obtained as follows: [57, 0.75), [70, 2.1], [85, 3.3), (100, 5.2]. [108,5,7). [115, 6.1). [130, 8.3). Plot a graph first and calculate a and b using the regression equations (Ch-10) a = -5, b = 0.2 a =5, b = 0.2 B. a = -5, b = 0.1 D. a = 5 b=0.1 mate with the math answer.) Many good time standard dat U U mated from graphs. formula for fitting a line to a set of data is called regression analysis. The x tes are used to calculate the variables a and b. The x and y data come from studies, Figure 10-1 in this example. e of counting cards and walking would look like this (again based on the times WALKING (IN PACES) NORMAL TIME (IN MINUTES) NORMAL TIME (IN MINUTES) COUNT CARDS .048 .093 .070 115 .140 .159 The regression line equations to solve for a and bare (2x)(y) - Ex(Exy) N(Ex?) - (2x) N(Exy) - Ex(Sy) N(Ex) - (2x) b = From the preceding table data, an extension of the data is needed. Walking n x y x xy 15 048 25 24 2 10 093 100 93 3 15 140 225 2.10 I 30 281 350 3.27 Substitution gives us the following: 3500.281) - 30(3.27) - 002 min 3(350) - (30) 3(3.27) - 300.281) = .009 min a = b = 3(350) - (30)

Step by Step Solution

There are 3 Steps involved in it

1 Expert Approved Answer
Step: 1 Unlock blur-text-image
Question Has Been Solved by an Expert!

Get step-by-step solutions from verified subject matter experts

Step: 2 Unlock
Step: 3 Unlock

Students Have Also Explored These Related General Management Questions!