

Question: A set of chaining survey data is presented in Table 1 below. Calculate the average distances of each line segment, corresponding discrepancy ratios, and the
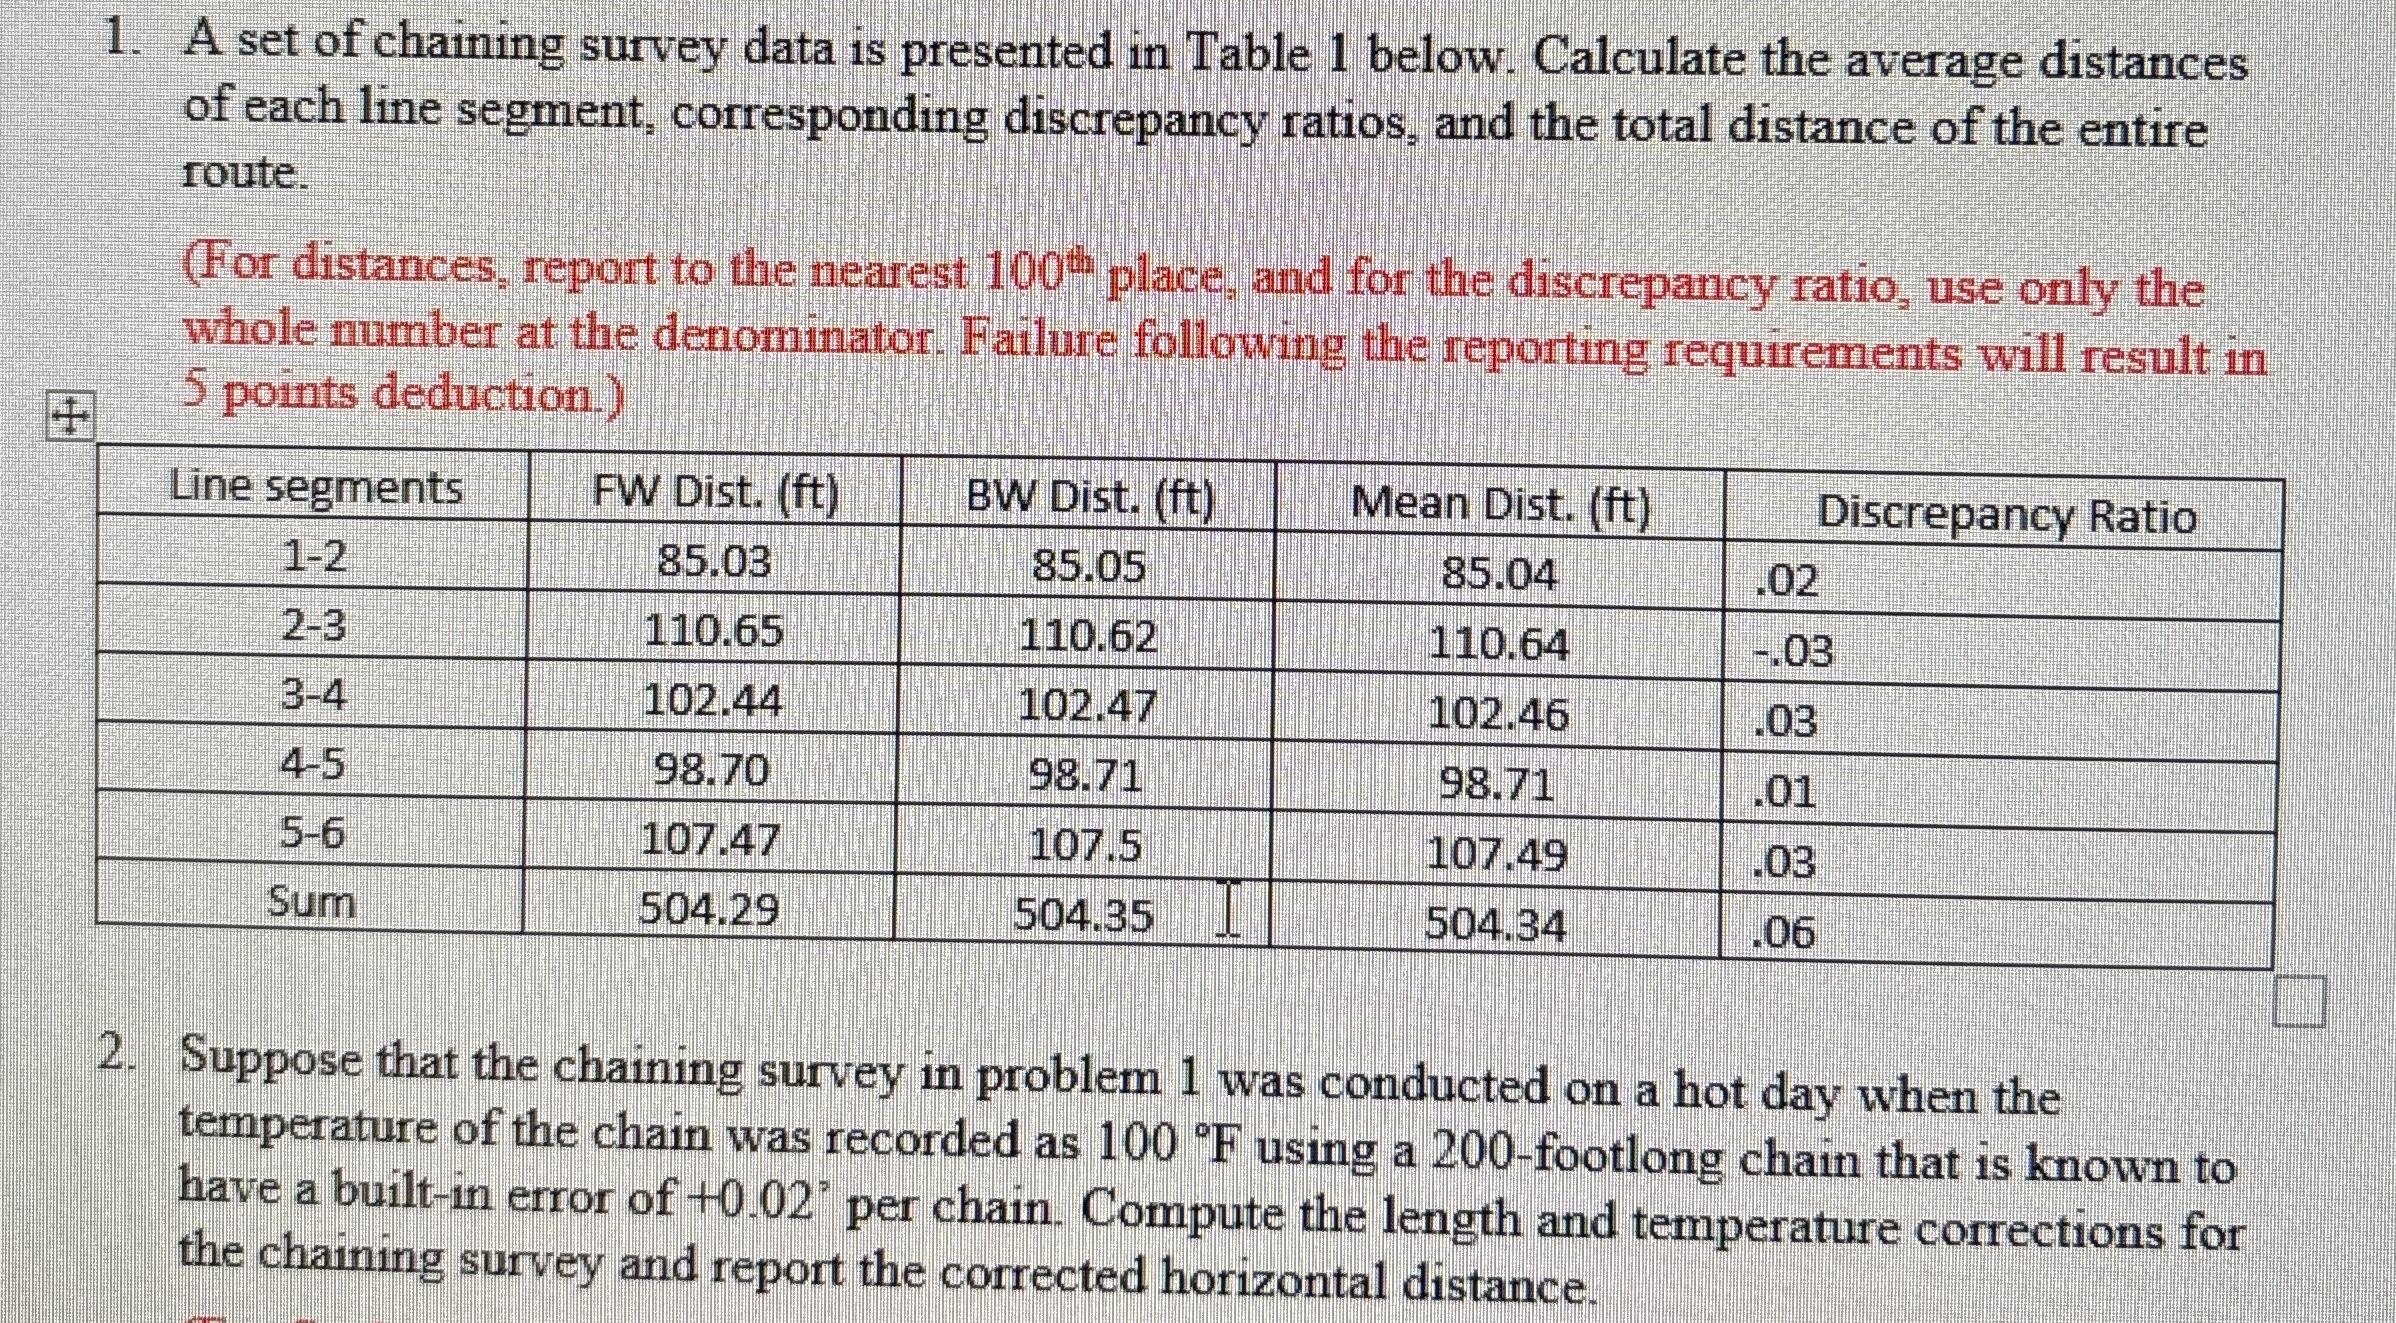
A set of chaining survey data is presented in Table below. Calculate the average distances of each line segment, corresponding discrepancy ratios, and the total distance of the entire route.
For distances, report to the nearest place, and for the discrepancy ratio, use only the whole number at the denominator. Failure following the reporting requirements will result in points deduction.
tableLine segments,FW Dist. ftBW Dist. ftMean Dist. ftDiscrepancy RatioSum
Suppose that the chaining survey in problem was conducted on a hot day when the temperature of the chain was recorded as using a footlong chain that is known to have a builtin error of per chain. Compute the length and temperature corrections for the chaining survey and report the corrected horizontal distance.
Step by Step Solution
There are 3 Steps involved in it
1 Expert Approved Answer
Step: 1 Unlock

Question Has Been Solved by an Expert!
Get step-by-step solutions from verified subject matter experts
Step: 2 Unlock
Step: 3 Unlock