

Question: A shows the variation in the data, however, it does not supply the statistical limits to determine if the process is stable. P chart Wrong
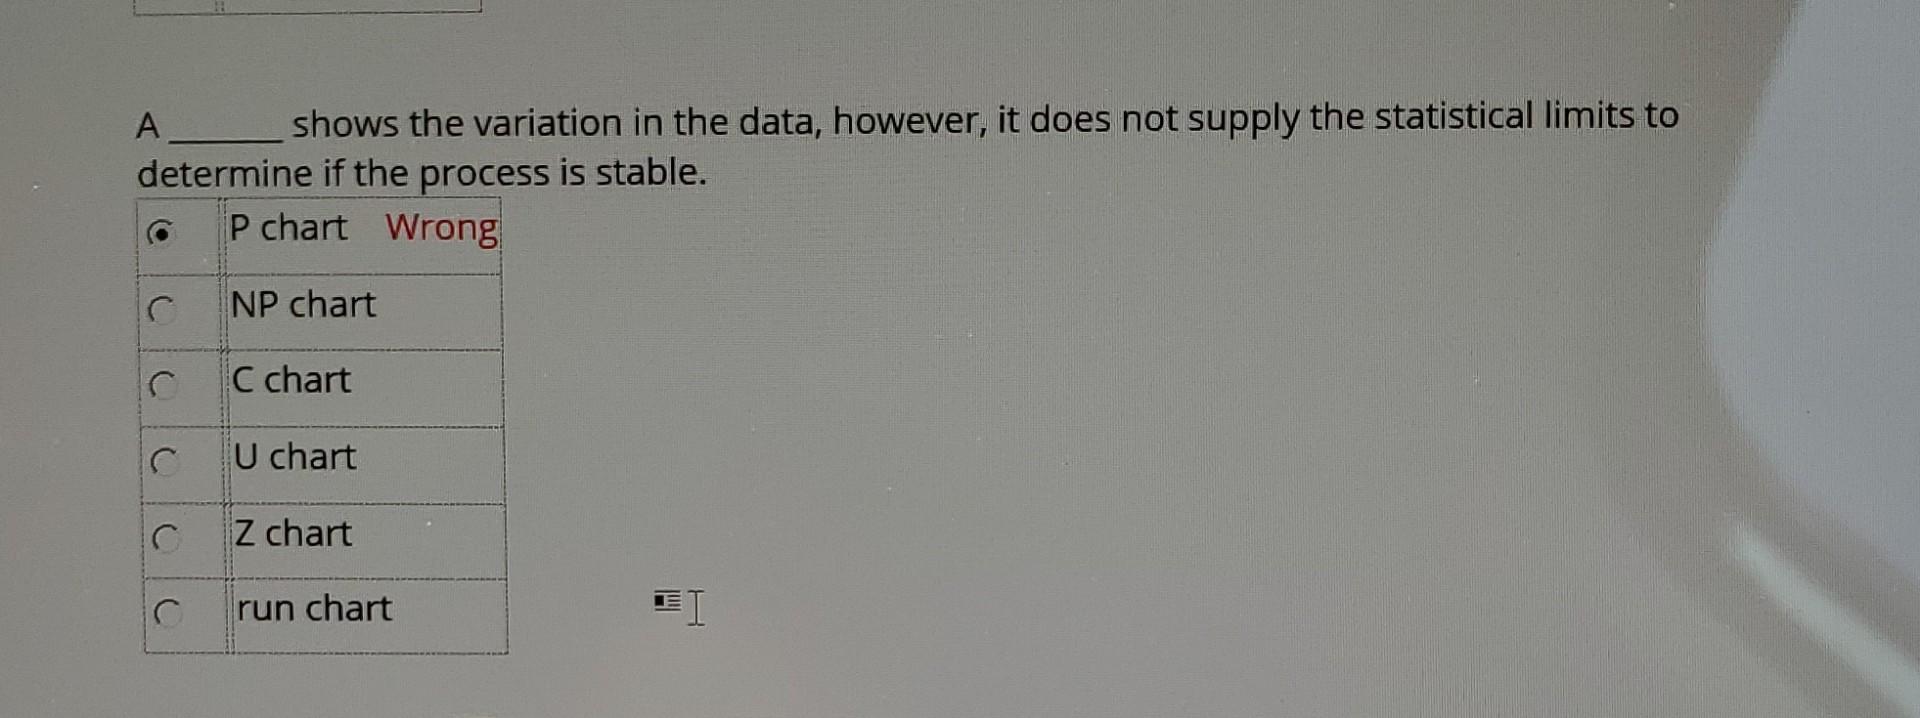
A shows the variation in the data, however, it does not supply the statistical limits to determine if the process is stable. P chart Wrong NP chart C C chart C U chart C Z chart C run chart 14
Step by Step Solution
There are 3 Steps involved in it
1 Expert Approved Answer
Step: 1 Unlock

Question Has Been Solved by an Expert!
Get step-by-step solutions from verified subject matter experts
Step: 2 Unlock
Step: 3 Unlock