

Question: A Six Sigma team at a large hotel collected data on the number of special requests for cleaning services made each day. The team wondered
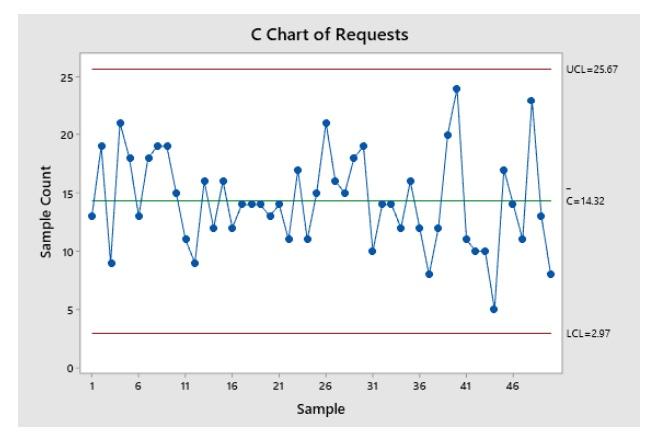
A Six Sigma team at a large hotel collected data on the number of special requests for cleaning services made each day. The team wondered if the number of requests varied by the day of the week or on days when many of the conference rooms were booked. The number of special requests each day are shown on the worksheet Requests. Here is a c-chart for this data:
a. What do the results from the control chart suggest about the variation in requests during the data collection period?
b. What should the team do next?
Step by Step Solution
There are 3 Steps involved in it
1 Expert Approved Answer
Step: 1 Unlock

Question Has Been Solved by an Expert!
Get step-by-step solutions from verified subject matter experts
Step: 2 Unlock
Step: 3 Unlock