

Question: A sociologist randomly selects single adults for different groups ofthree, PM E and the random variable x is the number in the group who say
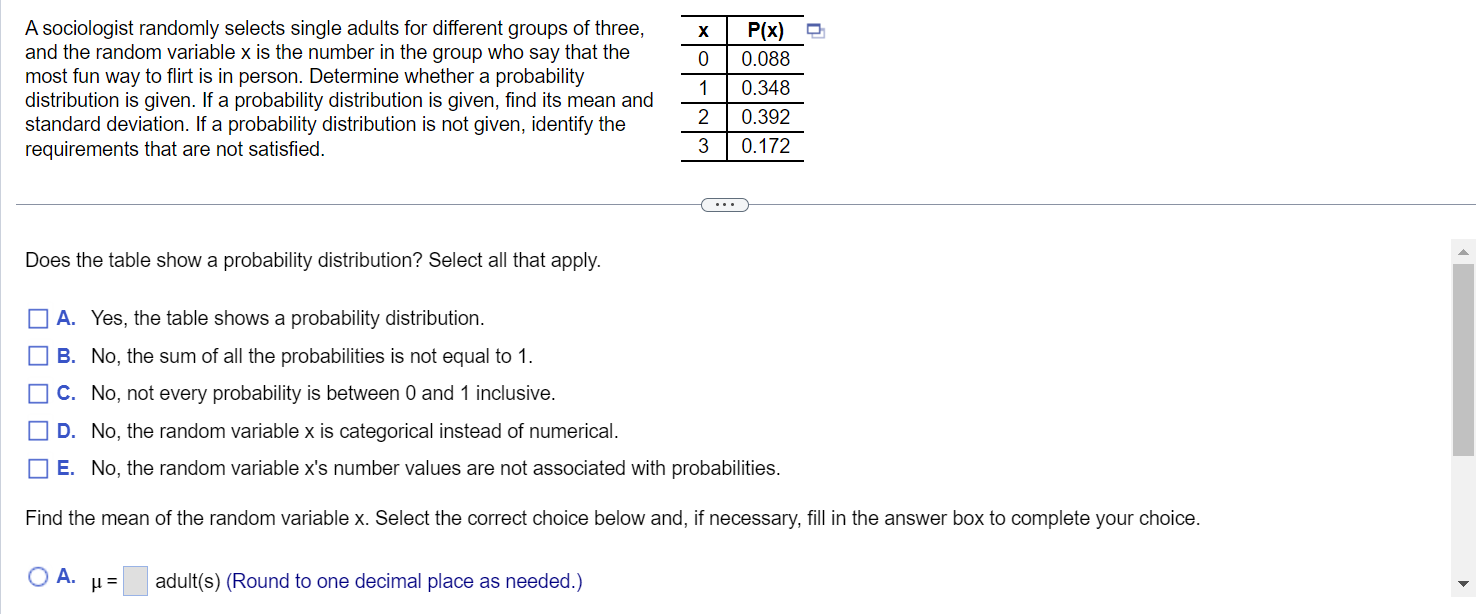
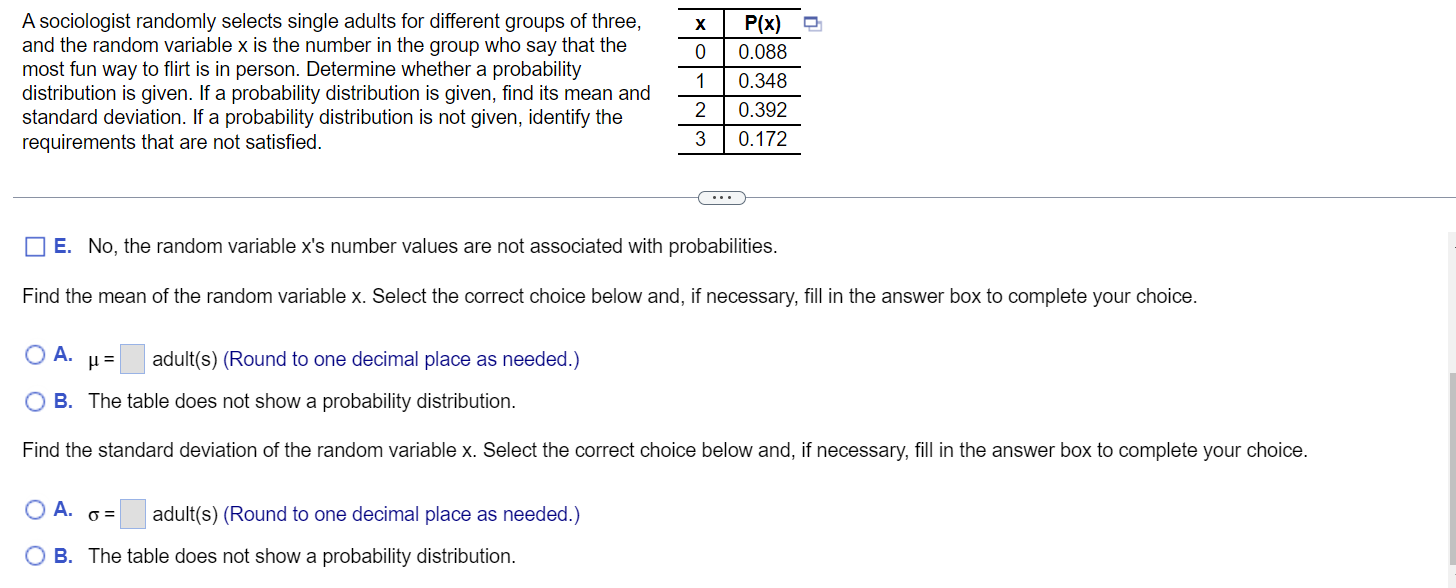
A sociologist randomly selects single adults for different groups ofthree, PM E and the random variable x is the number in the group who say that the 0.088 most fun way to irt is in person. Determine whether a probability 0 348 distribution is given. If a probability distribution is given, nd its mean and ' standard deviation. If a probability distribution is notgiven, identify the 0-392 requirements that are not satised. 0-172 Does the table show a probability distribution? Select all that apply. [I A. Yes, the table shows a probability distribution. [I B. No, the sum of all the probabilities is not equal to 1. [I C. No, not every probability is between 0 and 1 inclusive. [I D. No, the random variable x is categorical instead of numerical. [I E. No, the random variable x's number values are not associated with probabilities. Find the mean of the random variable x. Select the correct choice below and, if necessary, ll in the answer box to complete your choice. O A- p = adult(s) (Round to one decimal place as needed.) A sociologist randomly selects single adults for different groups of three, X P(x) and the random variable x is the number in the group who say that the 0 0.088 most fun way to flirt is in person. Determine whether a probability 0.348 distribution is given. If a probability distribution is given, find its mean and standard deviation. If a probability distribution is not given, identify the 2 0.392 requirements that are not satisfied. 3 0.172 . . . E. No, the random variable x's number values are not associated with probabilities. Find the mean of the random variable x. Select the correct choice below and, if necessary, fill in the answer box to complete your choice. O A. H= adult(s) (Round to one decimal place as needed.) O B. The table does not show a probability distribution. Find the standard deviation of the random variable x. Select the correct choice below and, if necessary, fill in the answer box to complete your choice. O A. 6= adult(s) (Round to one decimal place as needed.) O B. The table does not show a probability distribution
Step by Step Solution
There are 3 Steps involved in it

Get step-by-step solutions from verified subject matter experts