

Question: A spreadsheet containing sales data for different items, including the quantity sold in each month. The data is categorized into different groups using a filter
A spreadsheet containing sales data for different items, including the quantity sold in each month. The data is categorized into different groups using a filter (such as A, B, C, z, y, x). I need to calculate the average absolute error for each item, but the number of months that an item was sold varies, making it difficult to calculate a fixed average for all items. Additionally, there are empty cells between each item to separate them.
I am looking for a dynamic average function that can calculate the average absolute error for each item based on the number of months it was sold. I propose using the empty cells between each item as a boundary to determine the size of the data and to tell Excel to calculate the average for each item based on the data between the first and last empty cell.
Please help me create a dynamic average function that can calculate the average absolute error for each item based on its sales data, using the empty cells between each item as a boundary to determine the size of the data
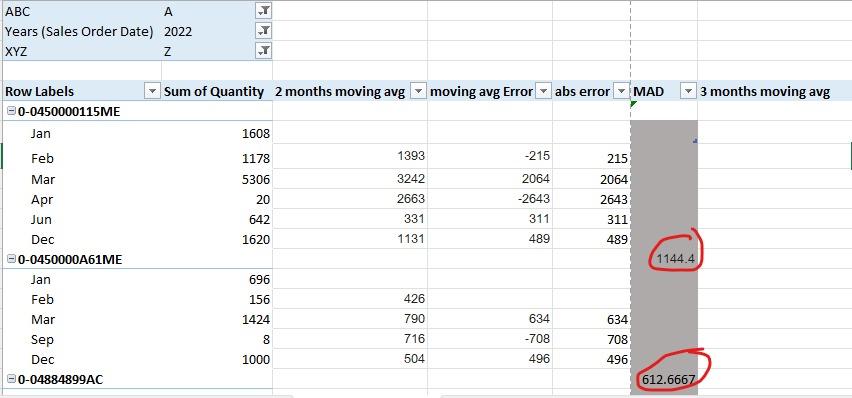
ABC A Years (Sales Order Date) 2022 XYZ Z Row Labels 0-0450000115ME Jan Feb Mar Apr Jun Dec 0-0450000A61ME Jan Feb Mar Sep Dec 0-04884899AC Sum of Quantity 2 months moving avg 1608 1178 5306 20 642 1620 696 156 1424 8 00 1000 1393 3242 2663 331 1131 426 790 716 504 moving avg Error abs error -215 2064 -2643 311 489 634 -708 496 215 2064 2643 311 489 634 708 496 MAD 1144.4 612.6667 3 months moving avg
Step by Step Solution
3.46 Rating (159 Votes )
There are 3 Steps involved in it
According to given question to calculate the dynamic average absolute error for each item based on its sales data we can use Excel formulas and some helper columns Below is a stepbystep solution Step ... View full answer

Get step-by-step solutions from verified subject matter experts