

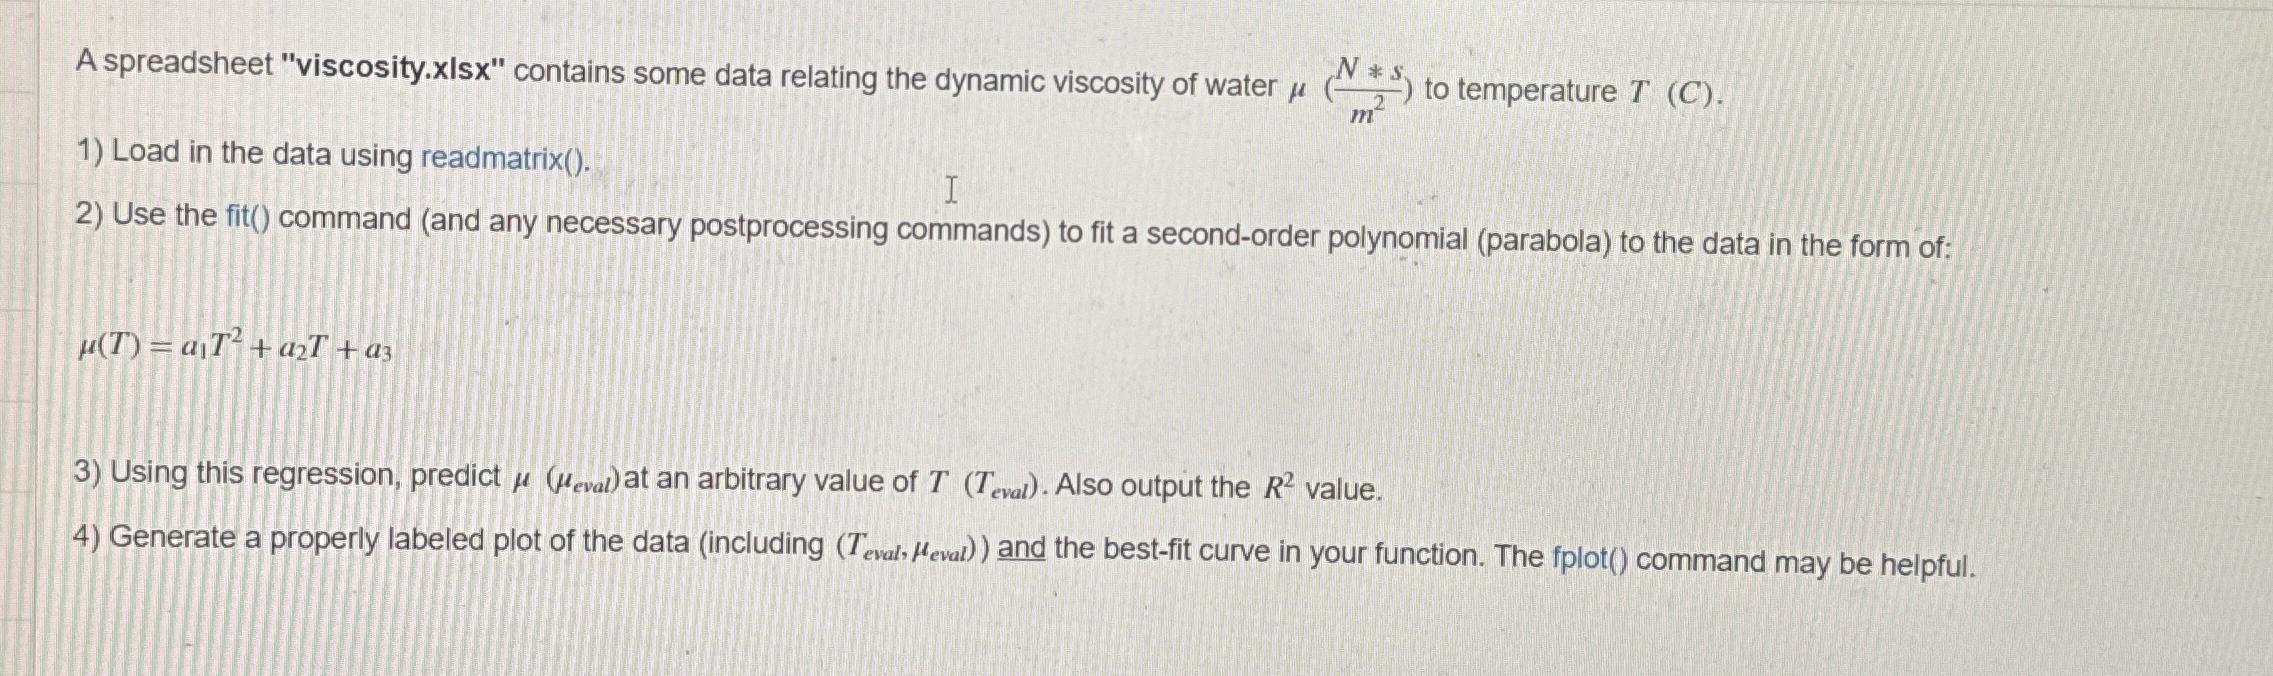
Question: A spreadsheet viscosity.xIsx contains some data relating the dynamic viscosity of water ( N * * s m 2 ) to temperature T ( C
A spreadsheet "viscosity.xIsx" contains some data relating the dynamic viscosity of water to temperature
Load in the data using readmatrix
Use the fit command and any necessary postprocessing commands to fit a secondorder polynomial parabola to the data in the form of:
Using this regression, predict at an arbitrary value of Also output the value.
Generate a properly labeled plot of the data including and the bestfit curve in your function. The fplot command may be helpful.
Step by Step Solution
There are 3 Steps involved in it
1 Expert Approved Answer
Step: 1 Unlock

Question Has Been Solved by an Expert!
Get step-by-step solutions from verified subject matter experts
Step: 2 Unlock
Step: 3 Unlock