

Question: (a) State the appropriate null and alternate hypotheses and what kind of tail it has (right, left, or two) (b) Compute the P -value and
(a) State the appropriate null and alternate hypotheses and what kind of tail it has (right, left, or two)
(b) Compute the P-value and test statistic
(c) State a conclusion. Use the given level of significance.
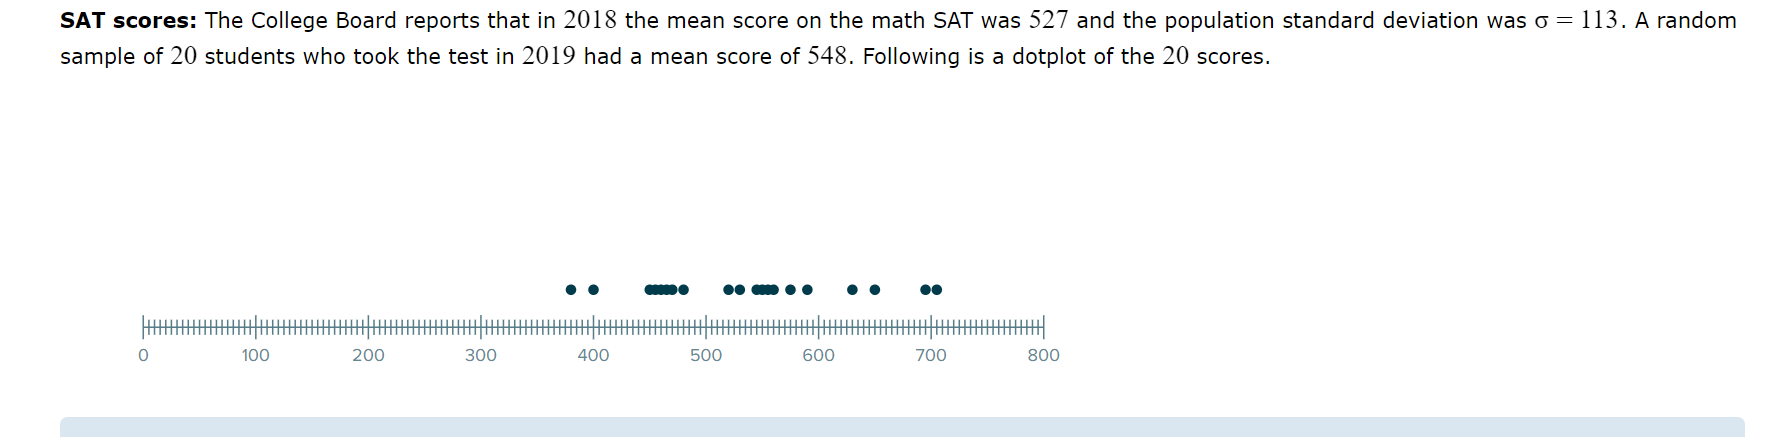
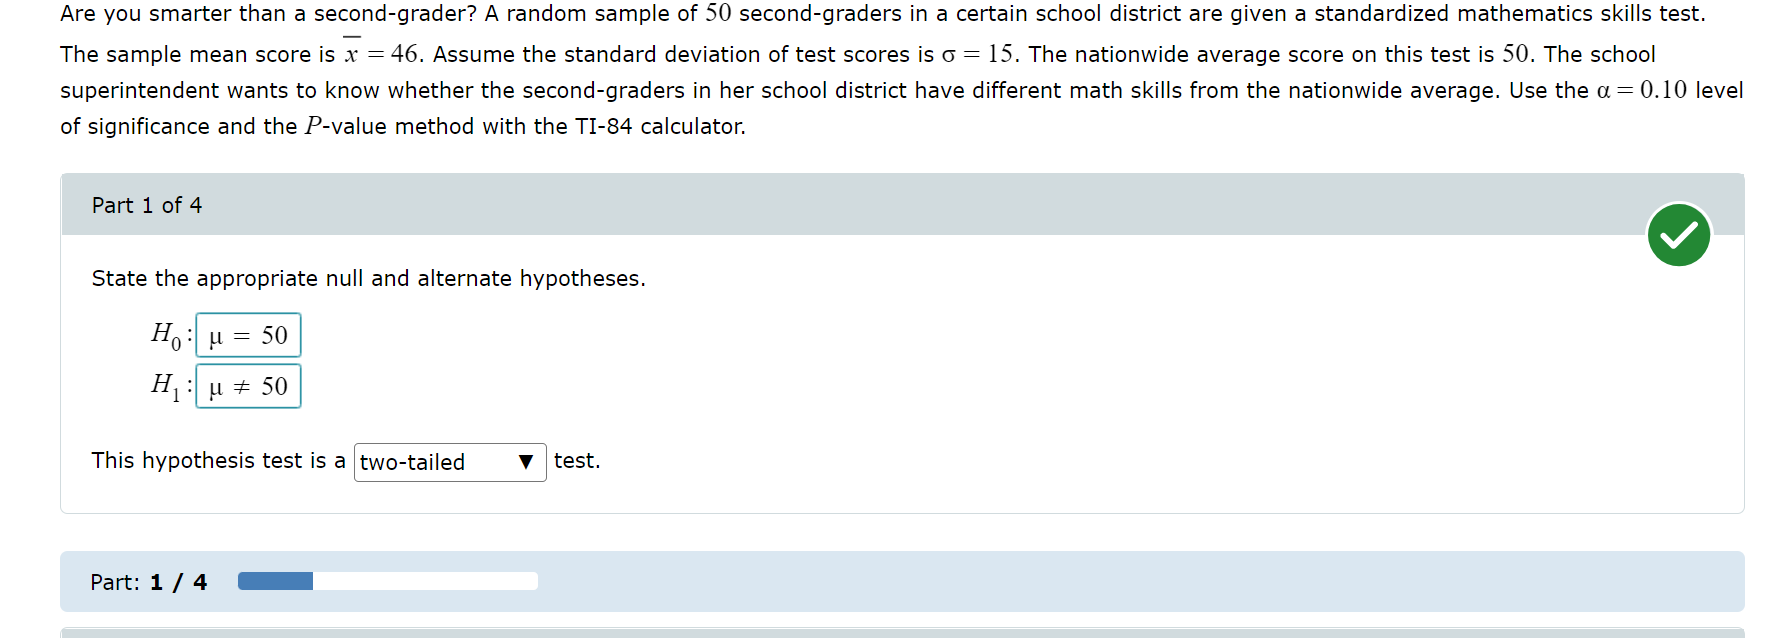
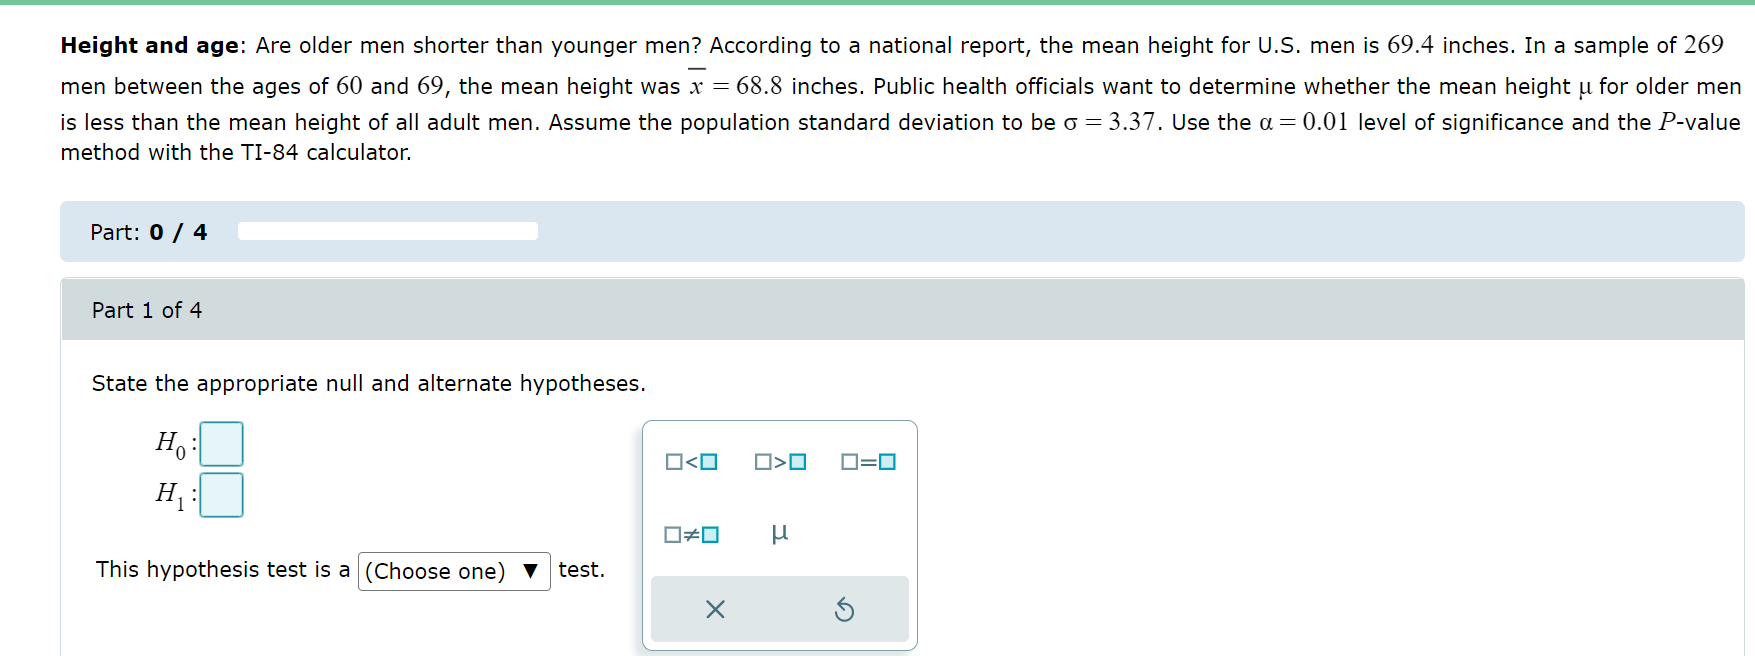
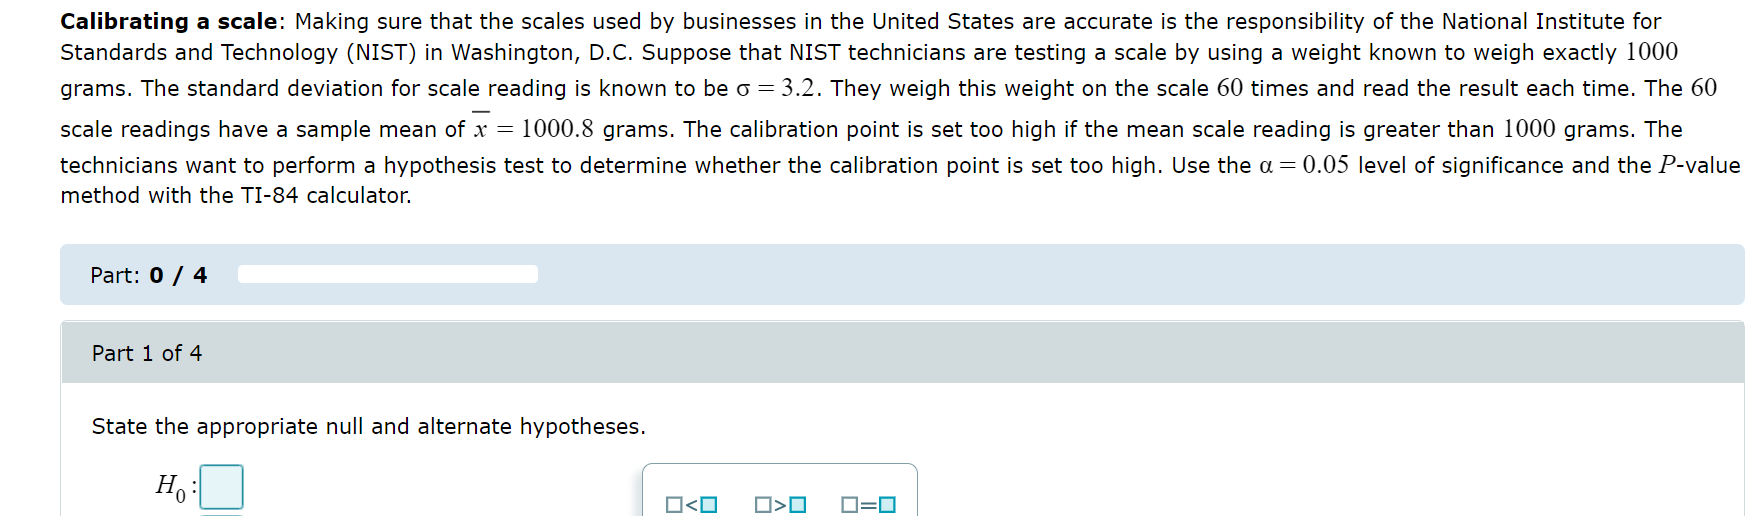
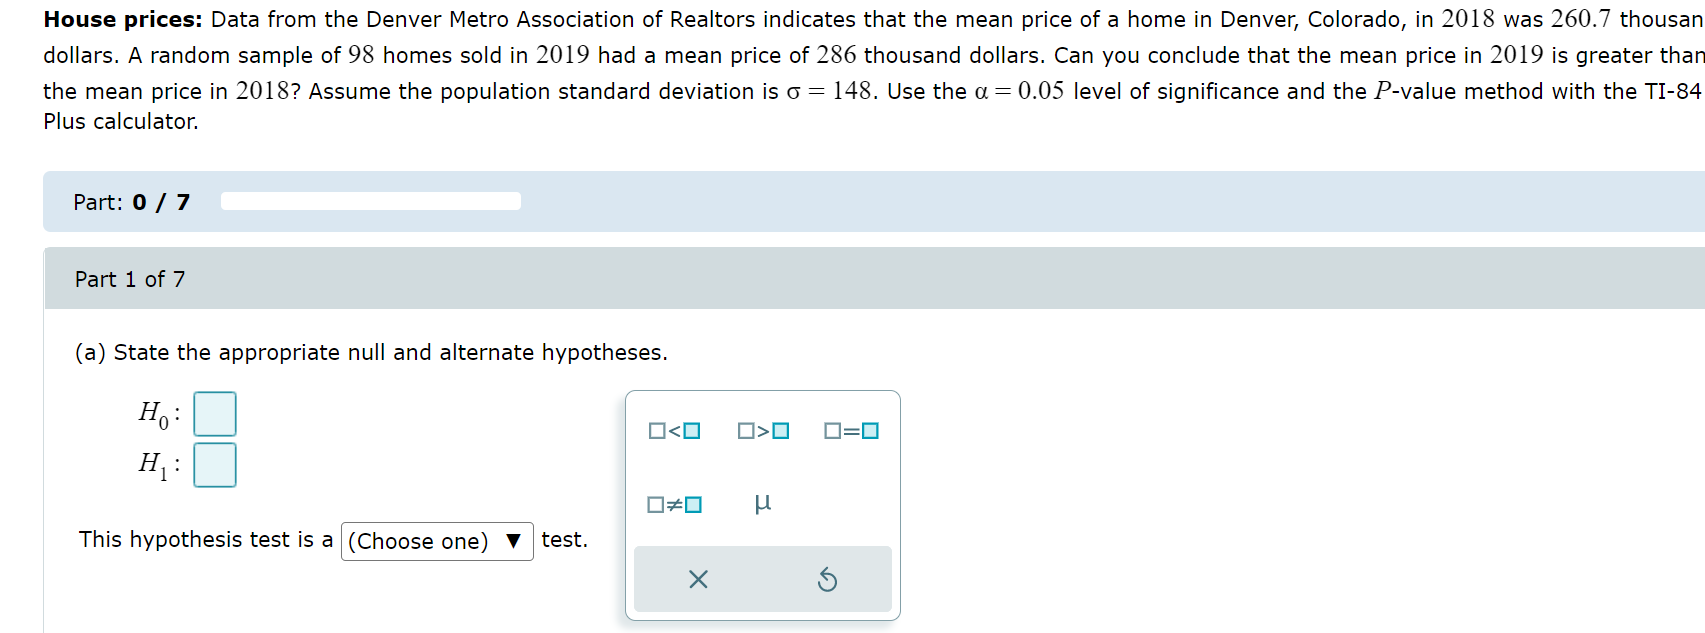
SAT scores: The College Board reports that in 2018 the mean score on the math SAT was 527 and the population standard deviation was 0' : 113. A random sample of 20 students who took the test in 2019 had a mean score of 548. Following is a dotplot of the 20 scores. 0 100 200 300 400 500 600 700 800 No, the sample size is too small and the sample does not appear to come from a population with an approximately normal distribution. _ 0 Yes, the sample size is large enough to perform the test, whether or not the population is normally distributed. Yes, the sample size is small, but we can see that the sample seems to come 0 from a population with an approximately normal distribution. Are you smarter than a second-grader? A random sample of 50 second-graders in a certain school district are given a standardized mathematics skills test. The sample mean score is x : 46. Assume the standard deviation of test scores is 0' : 15. The nationwide average score on this test is 50. The school superintendent wants to know whether the secondgraders in her school district have different math skills from the nationwide average. Use the a: 0.10 level of signicance and the Pvalue method with the 1184 calculator. State the appropriate null and alternate hypotheses. This hypothesis test is a test. Height and age: Are older men shorter than younger men? According to a national report, the mean height for U.S. men is 69.4 inches. In a sample of 269 men between the ages of 60 and 69, the mean height was x = 68.8 inches. Public health officials want to determine whether the mean height u for older men is less than the mean height of all adult men. Assume the population standard deviation to be o = 3.37. Use the a = 0.01 level of significance and the P-value method with the TI-84 calculator. Part: 0 / 4 Part 1 of 4 State the appropriate null and alternate hypotheses. HO : 0 0=0 H H This hypothesis test is a (Choose one) V test. X 5Calibrating a scale: Making sure that the scales used by businesses in the United States are accurate is the responsibility of the National Institute for Standards and Technology (NIST) in Washington, D.C. Suppose that NIST technicians are testing a scale by using a weight known to weigh exactly 1000 grams. The standard deviation for scale reading is known to be o = 3.2. They weigh this weight on the scale 60 times and read the result each time. The 60 scale readings have a sample mean of x = 1000.8 grams. The calibration point is set too high if the mean scale reading is greater than 1000 grams. The technicians want to perform a hypothesis test to determine whether the calibration point is set too high. Use the a = 0.05 level of significance and the P-value method with the TI-84 calculator. Part: 0 / 4 Part 1 of 4 State the appropriate null and alternate hypotheses. Ho : 0 0=0House prices: Data from the Denver Metro Association of Realtors indicates that the mean price of a home in Denver, Colorado, in 2018 was 260.7 thousan dollars. A random sample of 98 homes sold in 2019 had a mean price of 286 thousand dollars. Can you conclude that the mean price in 2019 is greater than the mean price in 2018? Assume the population standard deviation is o = 148. Use the a = 0.05 level of significance and the P-value method with the TI-84 Plus calculator. Part: 0 / 7 Part 1 of 7 (a) State the appropriate null and alternate hypotheses. Ho : 0 0=0 This hypothesis test is a (Choose one) V test. X 5
Step by Step Solution
There are 3 Steps involved in it

Get step-by-step solutions from verified subject matter experts