

Question: A statistical methods professor recorded the following final exam grades for a sample of ten students follows: i ) Determine the minimum, maximum, mean, mode,
A statistical methods professor recorded the following final exam grades for a sample of ten students
follows:
i Determine the minimum, maximum, mean, mode, median, the fint and third quartiles for the
above sample?
Mean
Mode
Median
Min
Max
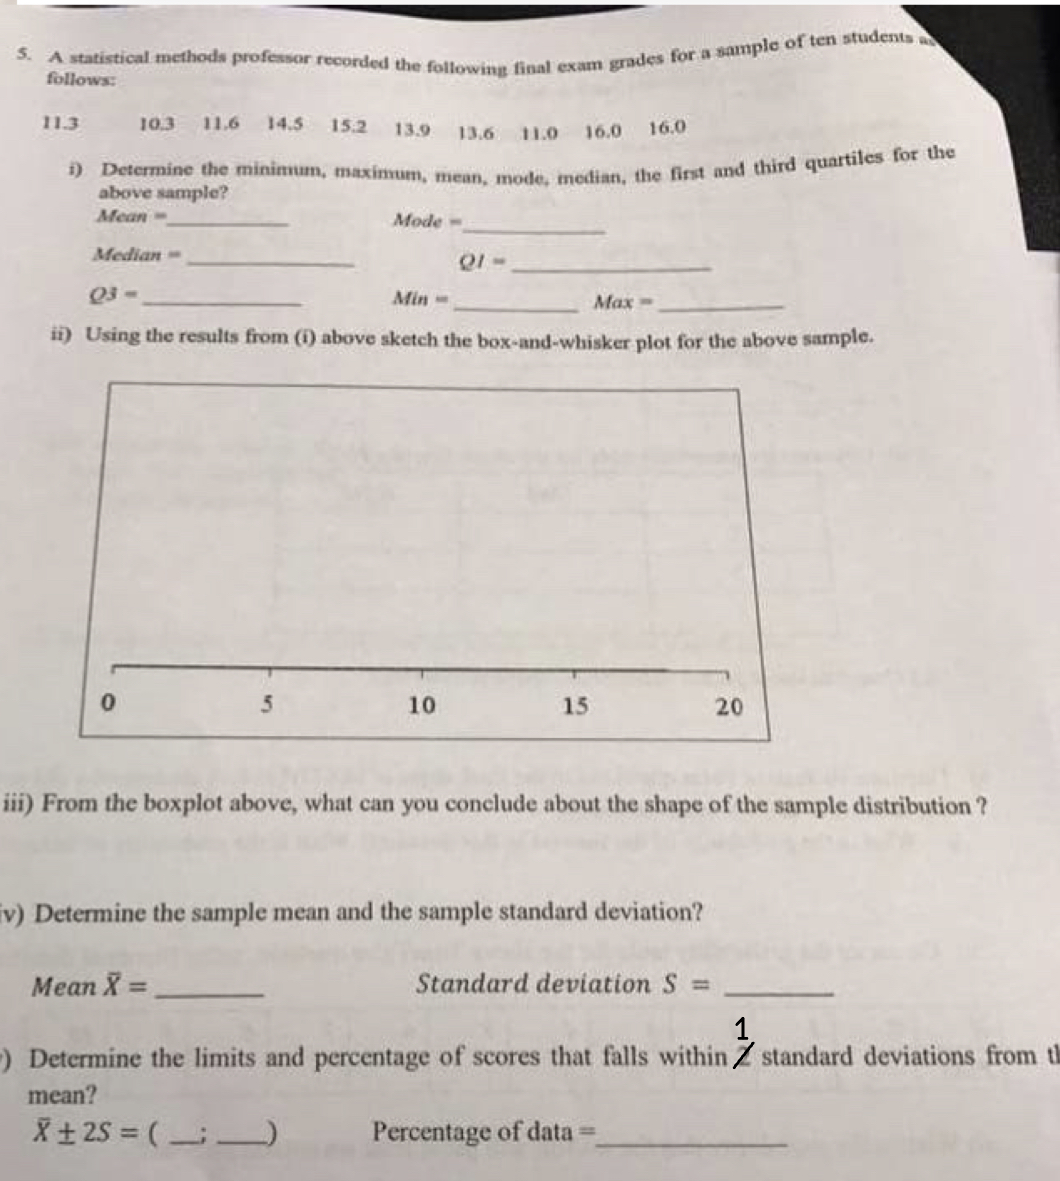
i Using the results from i above sketch the boxandwhisker plot for the above sample.
iii From the boxplot above, what can you conclude about the shape of the sample distribution?
v Determine the sample mean and the sample standard deviation?
Mean
Standard deviation
Determine the limits and percentage of scores that falls within standard deviations from
mean?
Percentage of data
Step by Step Solution
There are 3 Steps involved in it
1 Expert Approved Answer
Step: 1 Unlock

Question Has Been Solved by an Expert!
Get step-by-step solutions from verified subject matter experts
Step: 2 Unlock
Step: 3 Unlock