

Question: A statistical program is recommended. Consider the following data for two variables, x and y. 22 24 26 30 35 40 13 20 3 34
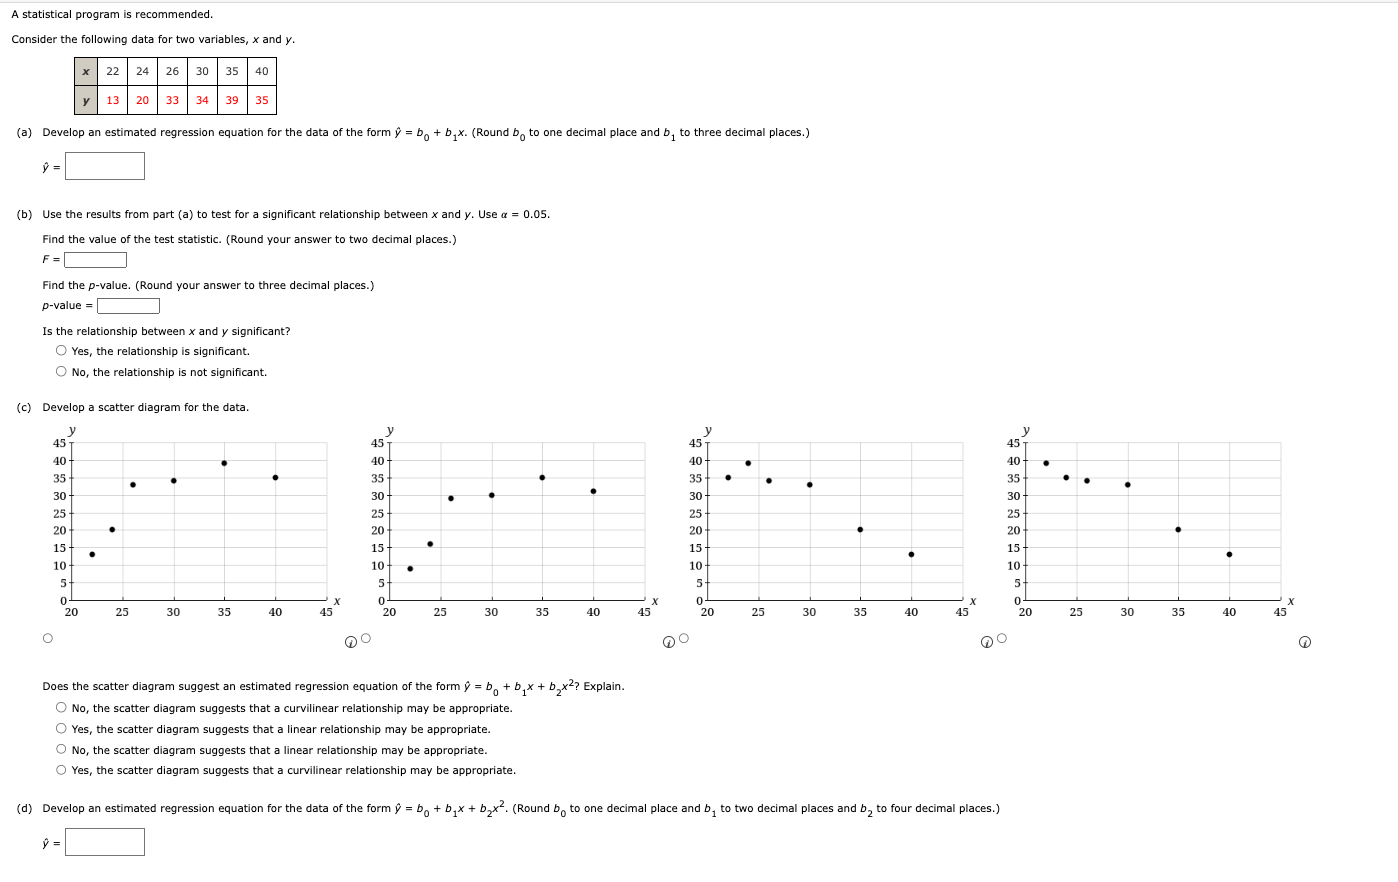
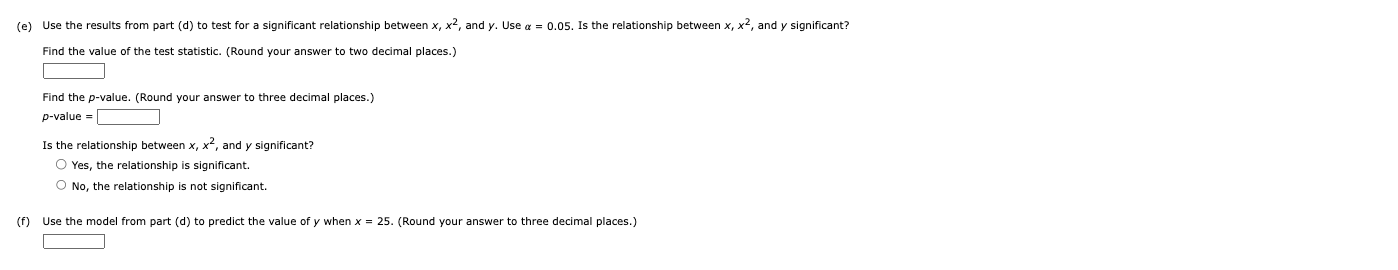
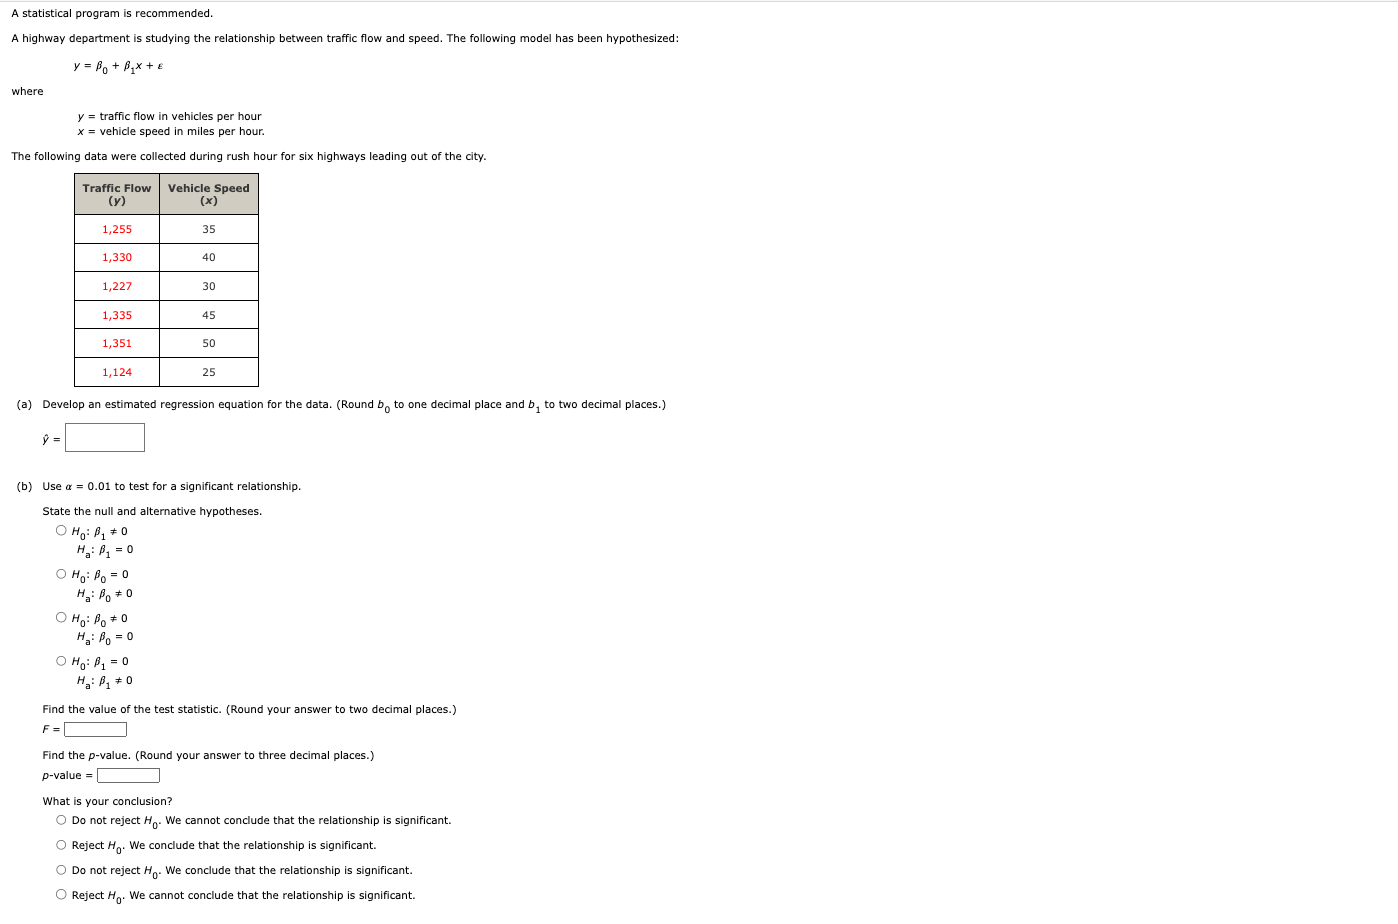
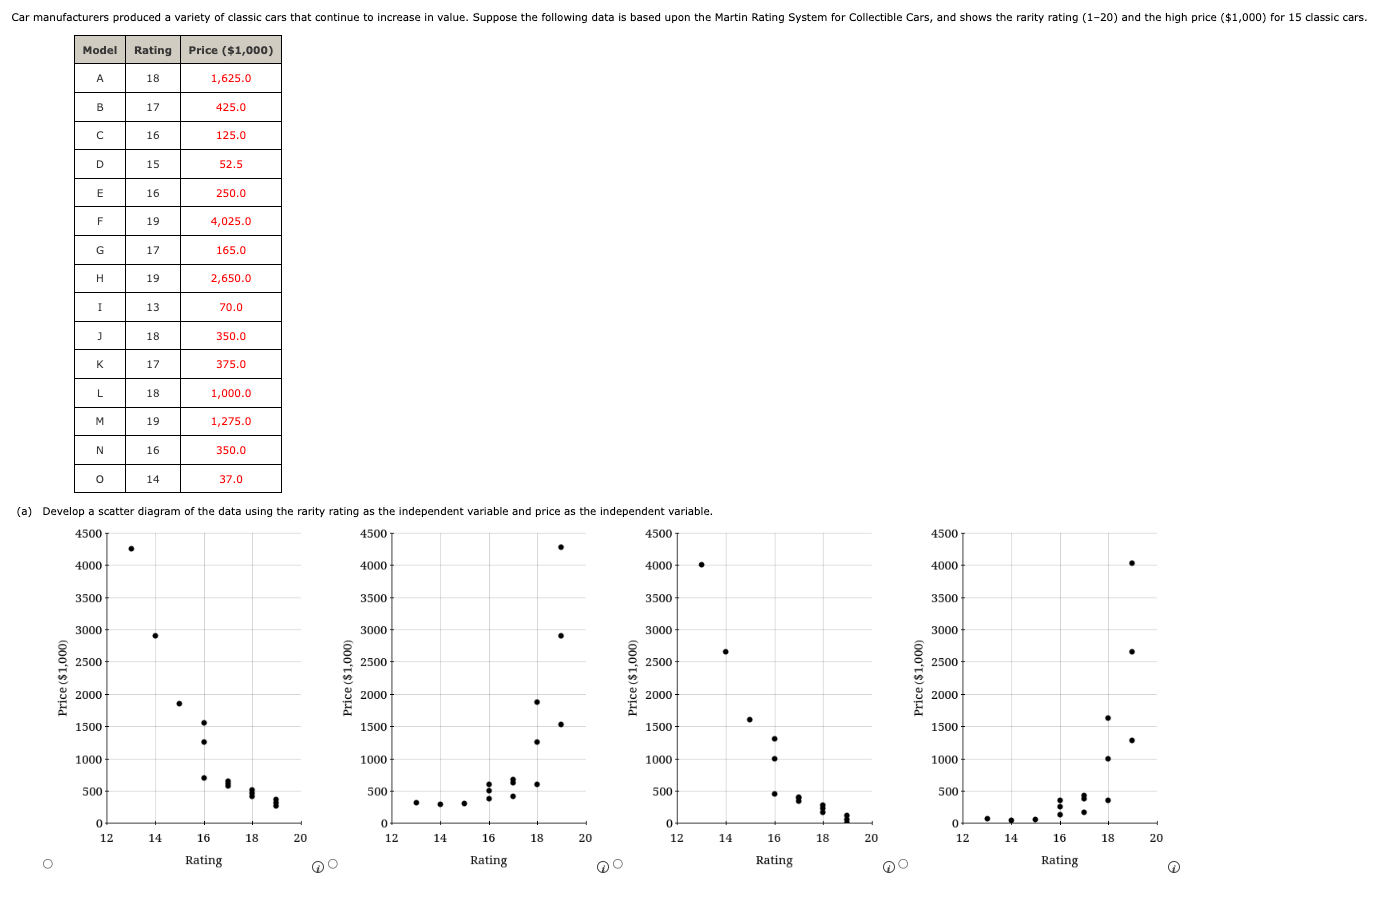
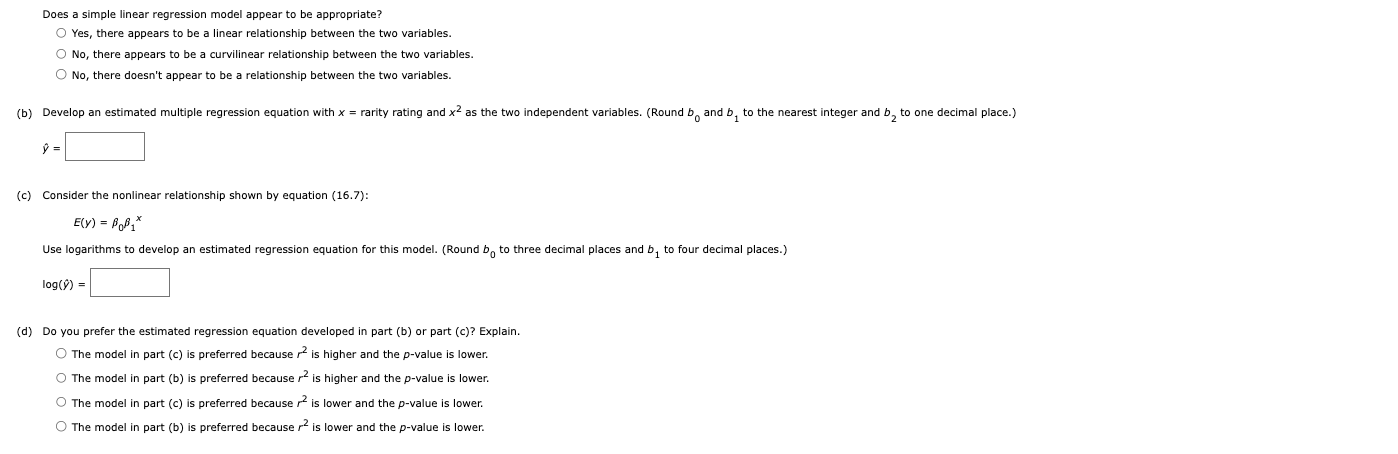
A statistical program is recommended. Consider the following data for two variables, x and y. 22 24 26 30 35 40 13 20 3 34 39 35 (a) Develop an estimated regression equation for the data of the form y = by + b, x. (Round b, to one decimal place and b, to three decimal places.) (b) Use the results from part (a) to test for a significant relationship between x and y. Use a = 0.05. Find the value of the test statistic. (Round your answer to two decimal places.) F = Find the p-value. (Round your answer to three decimal places.) p-value = Is the relationship between x and y significant? O Yes, the relationship is significant. No, the relationship is not significant. (c) Develop a scatter diagram for the data. 457 45 457 45 T 40- 40 40 - 35 35 35 35 30 30 30- 30 25 25 25 25 20 20 20 20 15 15 15 15 10- 0 10 10+ 5- 5 5 5- 25 30 35 40 45 20 25 30 35 40 45 20 25 30 35 40 45 20 25 30 35 40 45 O DO Does the scatter diagram suggest an estimated regression equation of the form y = bo + b x + b,x2? Explain. O No, the scatter diagram suggests that a curvilinear relationship may be appropriate. O Yes, the scatter diagram suggests that a linear relationship may be appropriate. O No, the scatter diagram suggests that a linear relationship may be appropriate. Yes, the scatter diagram suggests that a curvilinear relationship may be appropriate. (d) Develop an estimated regression equation for the data of the form y = bo + bjx + b2x2. (Round bo to one decimal place and b, to two decimal places and by to four decimal places.) D =(e) Use the results from part (d) to test for a significant relationship between x, x2, and y. Use a = 0.05. Is the relationship between x, x2, and y significant? Find the value of the test statistic. (Round your answer to two decimal places.) Find the p-value. (Round your answer to three decimal places.) p-value = Is the relationship between x, x, and y significant? O Yes, the relationship is significant. O No, the relationship is not significant. (f) Use the model from part (d) to predict the value of y when x = 25. (Round your answer to three decimal places.)A statistical program is recommended. A highway department is studying the relationship between traffic flow and speed. The following model has been hypothesized: y = PotAxte where y = traffic flow in vehicles per hour x = vehicle speed in miles per hour. The following data were collected during rush hour for six highways leading out of the city. Traffic Flow Vehicle Speed (y) (x) 1,255 35 1,330 40 1,227 30 1,335 45 1,351 50 1,124 25 (a) Develop an estimated regression equation for the data. (Round bo to one decimal place and b, to two decimal places.) (b) Use a = 0.01 to test for a significant relationship. State the null and alternative hypotheses. OHO: $1 0 Ha: P1 = 0 OHo: Po = 0 H : P0 0 OH: 80 0 Ha : Po = 0 OH,: $1 = 0 Find the value of the test statistic. (Round your answer to two decimal places.) F = Find the p-value. (Round your answer to three decimal places.) p-value = What is your conclusion? O Do not reject Ho. We cannot conclude that the relationship is significant. O Reject Ho. We conclude that the relationship is significant. O Do not reject Ho. We conclude that the relationship is significant. O Reject Ho. We cannot conclude that the relationship is significant.Car manufacturers produced a variety of classic cars that continue to increase in value. Suppose the following data is based upon the Martin Rating System for Collectible Cars, and shows the rarity rating (1-20) and the high price ($1,000) for 15 classic cars. Model Rating Price ($1,000) A 18 1,625.0 B 17 425.0 C 16 125.0 D 15 52.5 16 250.0 F 19 4,025.0 G 17 165.0 H 19 2,650.0 13 70.0 18 350.0 K 17 375.0 18 1,000.0 M 19 1,275.0 N 16 350.0 O 14 37.0 (a) Develop a scatter diagram of the data using the rarity rating as the independent variable and price as the independent variable. 4500 4500 4500 4500 T 4000 4000 4000 4000 3500 3500 3500 3500 3000 3000 3000 3000 2500 2500 2500 2500 Price ($1,000) Price ($1,000) Price ($1,000) Price ($1,000) 2000 4000 2000 2000 1500 1500 1500 1500 1000 1000 1000 1000 500 500 500 500 0+ 12 14 16 18 20 12 14 16 18 20 17 14 16 18 20 12 14 16 18 20 Rating Rating Rating Rating ODoes a simple linear regression model appear to be appropriate? O Yes, there appears to be a linear relationship between the two variables. O No, there appears to be a curvilinear relationship between the two variables. O No, there doesn't appear to be a relationship between the two variables. (b) Develop an estimated multiple regression equation with x = rarity rating and x2 as the two independent variables. (Round b, and b, to the nearest integer and b, to one decimal place.) (c) Consider the nonlinear relationship shown by equation (16.7): E(V) = BOB1x Use logarithms to develop an estimated regression equation for this model. (Round bo to three decimal places and b, to four decimal places.) log()) = (d) Do you prefer the estimated regression equation developed in part (b) or part (c)? Explain. The model in part (c) is preferred because ~ is higher and the p-value is lower. O The model in part (b) is preferred because r is higher and the p-value is lower. The model in part (c) is preferred because r is lower and the p-value is lower. The model in part (b) is preferred because r is lower and the p-value is lower
Step by Step Solution
There are 3 Steps involved in it

Get step-by-step solutions from verified subject matter experts