

Question: A statistics professor suggests there may be a negative relationship between a student's grade and the time between visits (TBV) to an online stats course.
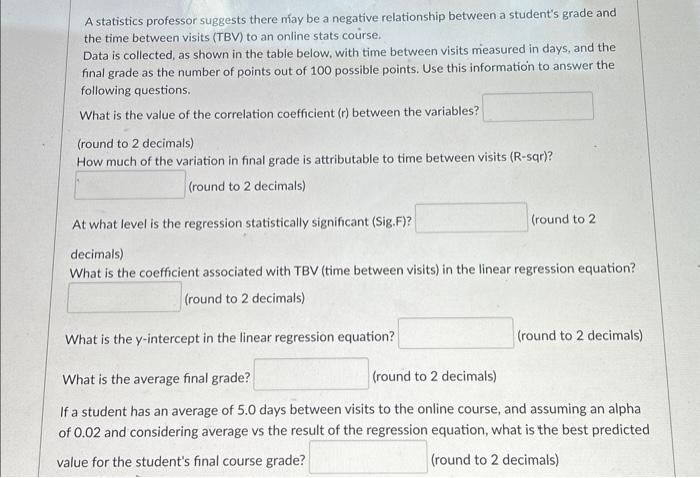
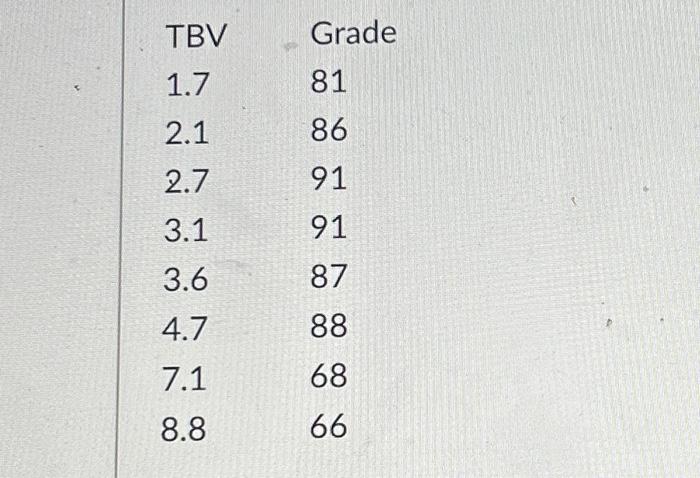
A statistics professor suggests there may be a negative relationship between a student's grade and the time between visits (TBV) to an online stats course. Data is collected, as shown in the table below, with time between visits measured in days, and the final grade as the number of points out of 100 possible points. Use this information to answer the following questions. What is the value of the correlation coefficient (r) between the variables? (round to 2 decimals) How much of the variation in final grade is attributable to time between visits ( R-sqr)? (round to 2 decimals) At what level is the regression statistically significant (Sig.F)? (round to 2 decimals) What is the coefficient associated with TBV (time between visits) in the linear regression equation? (round to 2 decimals) What is the y-intercept in the linear regression equation? (round to 2 decimals) What is the average final grade? (round to 2 decimals) f a student has an average of 5.0 days between visits to the online course, and assuming an alpha of 0.02 and considering average vs the result of the regression equation, what is the best predicted alue for the student's final course grade? (round to 2 decimals) \begin{tabular}{ll} TBV & Grade \\ 1.7 & 81 \\ 2.1 & 86 \\ 2.7 & 91 \\ 3.1 & 91 \\ 3.6 & 87 \\ 4.7 & 88 \\ 7.1 & 68 \\ 8.8 & 66 \end{tabular}
Step by Step Solution
There are 3 Steps involved in it

Get step-by-step solutions from verified subject matter experts