

Question: A stores demand figures are given in the table. According to this, what is the linear regression forecast for Week 12. (You need to use
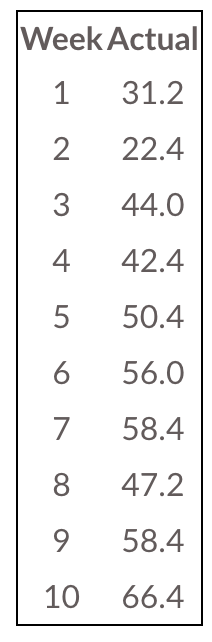
A stores demand figures are given in the table. According to this, what is the linear regression forecast for Week 12. (You need to use Excel to solve this problem. Do not round intermediate calculations. Round your final answers to two decimal places.
\begin{tabular}{|cc|} \hline Week Actual \\ 1 & 31.2 \\ 2 & 22.4 \\ 3 & 44.0 \\ 4 & 42.4 \\ 5 & 50.4 \\ 6 & 56.0 \\ 7 & 58.4 \\ 8 & 47.2 \\ 9 & 58.4 \\ 10 & 66.4 \\ \hline \end{tabular}
Step by Step Solution
There are 3 Steps involved in it
1 Expert Approved Answer
Step: 1 Unlock

Question Has Been Solved by an Expert!
Get step-by-step solutions from verified subject matter experts
Step: 2 Unlock
Step: 3 Unlock