

Question: A student collects data as per the first procedure, and obtains 1 0 pairs of frequency and wavelength measurements. They wish to construct a plot
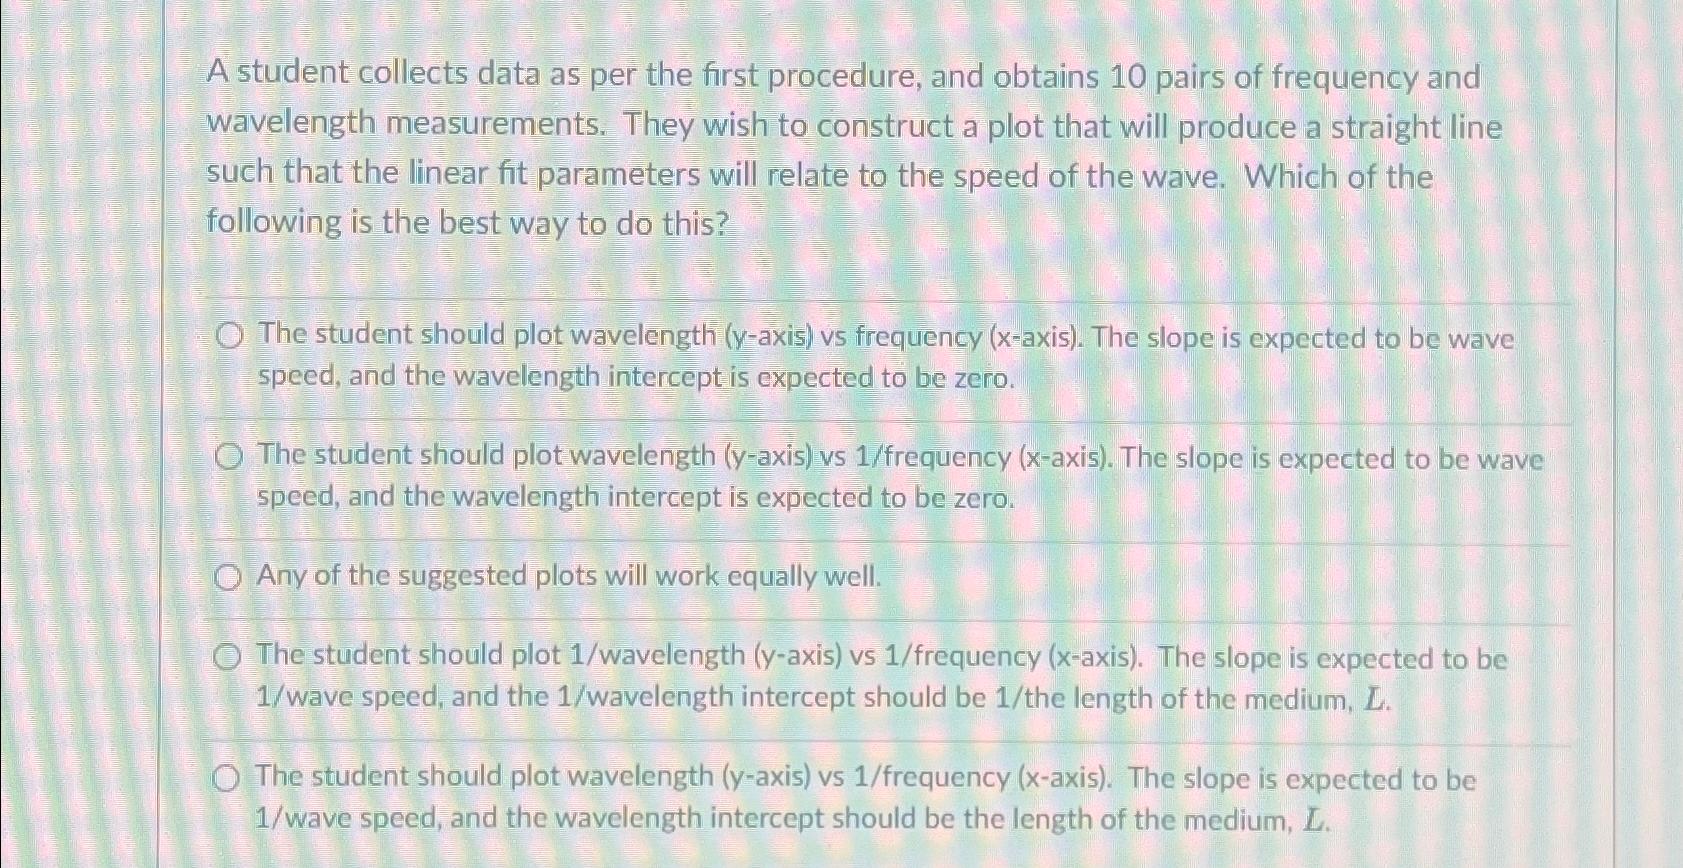
A student collects data as per the first procedure, and obtains pairs of frequency and wavelength measurements. They wish to construct a plot that will produce a straight line such that the linear fit parameters will relate to the speed of the wave. Which of the following is the best way to do this?
The student should plot wavelength axis vs frequency axis The slope is expected to be wave speed, and the wavelength intercept is expected to be zero.
The student should plot wavelength axis vs frequency axis The slope is expected to be wave speed, and the wavelength intercept is expected to be zero.
Any of the suggested plots will work equally well.
The student should plot wavelength axis vs frequency axis The slope is expected to be wave speed, and the wavelength intercept should be the length of the medium,
The student should plot wavelength axis vs frequency xaxis The slope is expected to be wave speed, and the wavelength intercept should be the length of the medium,
Step by Step Solution
There are 3 Steps involved in it
1 Expert Approved Answer
Step: 1 Unlock

Question Has Been Solved by an Expert!
Get step-by-step solutions from verified subject matter experts
Step: 2 Unlock
Step: 3 Unlock