

Question: A student drew the following scatterplot: 100 90 Score on Final Examination 10 MathBits' Graph 2 3 4 5 6 7 8 9 10 Hours
A student drew the following scatterplot:
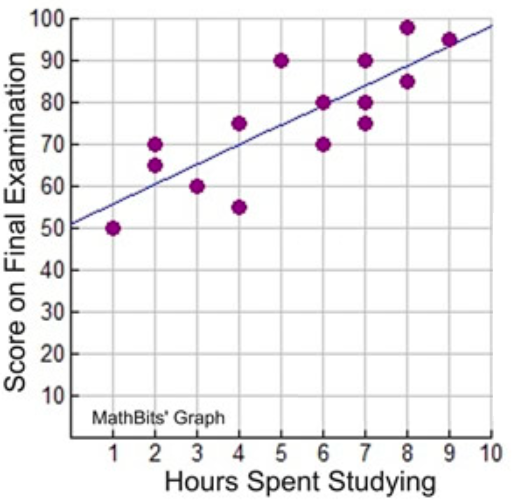
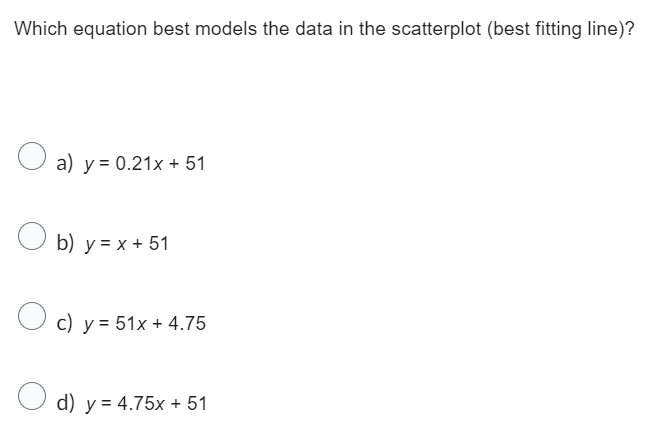
100 90 Score on Final Examination 10 MathBits' Graph 2 3 4 5 6 7 8 9 10 Hours Spent StudyingWhich equation best models the data in the scatterplot (best fitting line)? a) y= 0.21x + 51 O b) y= x + 51 O c) y = 51x + 4.75 O d) y= 4.75x + 51
Step by Step Solution
There are 3 Steps involved in it
1 Expert Approved Answer
Step: 1 Unlock

Question Has Been Solved by an Expert!
Get step-by-step solutions from verified subject matter experts
Step: 2 Unlock
Step: 3 Unlock